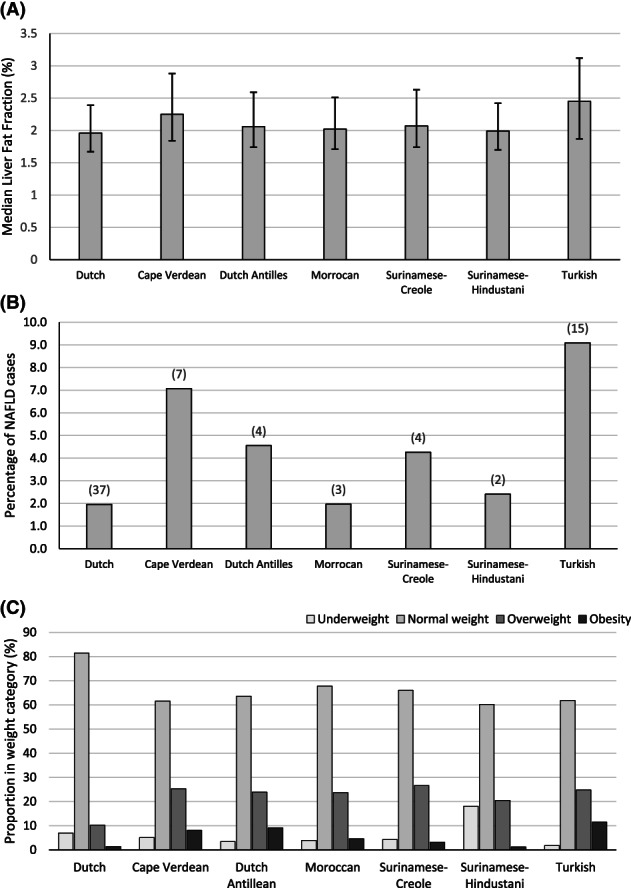
FIGURE 1.

Bar graphs displaying liver fat and weight category distribution for each ethnic group. (A) Median liver fat fraction for each ethnic group, along with the corresponding interquartile range. Medians are presented as liver fat fraction was non‐normally distributed. (B) Proportion of NAFLD presence for each ethnic group, with the absolute number of cases per group above each bar. (C) Proportion per weight category in percentage for each ethnic group. NAFLD, nonalcoholic fatty liver disease
