
FIGURE 2.
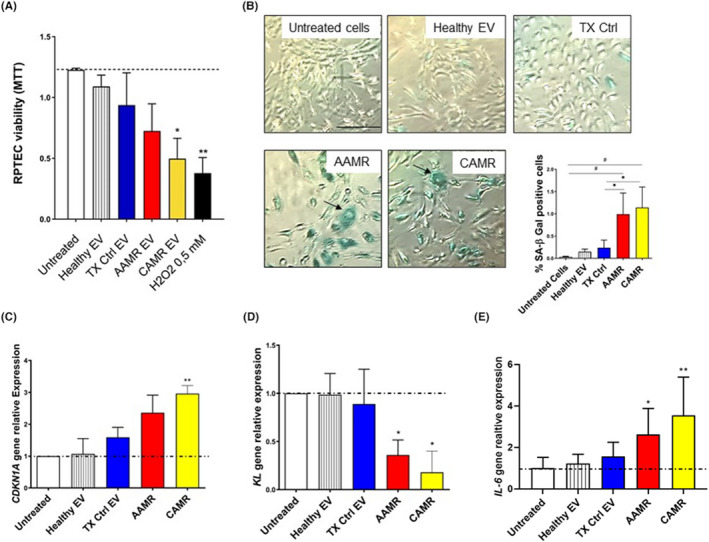
AMR‐derived EV induced cellular senescence in RPTEC culture. (A) RPTEC were plated in 96‐well plate, treated with EV purified from plasma of AMR patients (5e+4 EV/cells target for 24 h) and MTT assay was performed. Untreated cells (indicated as basal), cell exposed to healthy EV and to TX Ctrl patients were used as controls. H2O2 (0.5 mM) was used as positive control for cell viability reduction. Data represent the mean ± SD; n = 3, *p < .05, **p < .01, one‐way ANOVA nonparametric test. (B) SA‐β Gal staining in RPTEC treated with EV purified from AMR patients plasma in early passage RPTEC (5e+4 EV/cells target for 24 h). Increased SA‐β‐Gal+ cells were observed after AAMR and CAMR EV exposition. Compared with untreated cells and to healthy EV and TX Ctrl EV exposed cells, AAMR, and CAMR EV‐treated cells were positive to SA‐β Gal, appeared enlarged, with formation of larger and polynucleated cells (arrows and boxes). H2O2 (0.5–1 mM) exposed cells were used as positive control of senescence (not showed). Scale bar: 200 μm. The graph shows the quantification of SA‐β‐Gal+ cells. The ratio of cells positive for SA‐β‐gal activity was calculated in five not overlapping fields per condition (six‐well plate). Data are shown as mean ± SD of three independent experiments and the medians were analyzed by Kruskal–Wallis test (p < .05 between all groups) with an option for multiple comparisons (#p < .01 vs. untreated cells, *p < .05 vs. TX Ctrl). (C) Gene expression of p21 waf1/cip1 (CDKN1A), (D) KL and IL‐6 evaluated by qPCR in RPTEC exposed to EV for 24 h (5e+4 EV/cells target). Data were normalized to β‐actin housekeeping gene. Data are shown as mean ± SD of three independent experiments and the medians were analyzed by Mann–Whitney U test. *p < .05, **p < .01. H2O2 at 0.3–0.5 mM exposed cells were used as positive control of senescence.