
FIGURE 4.
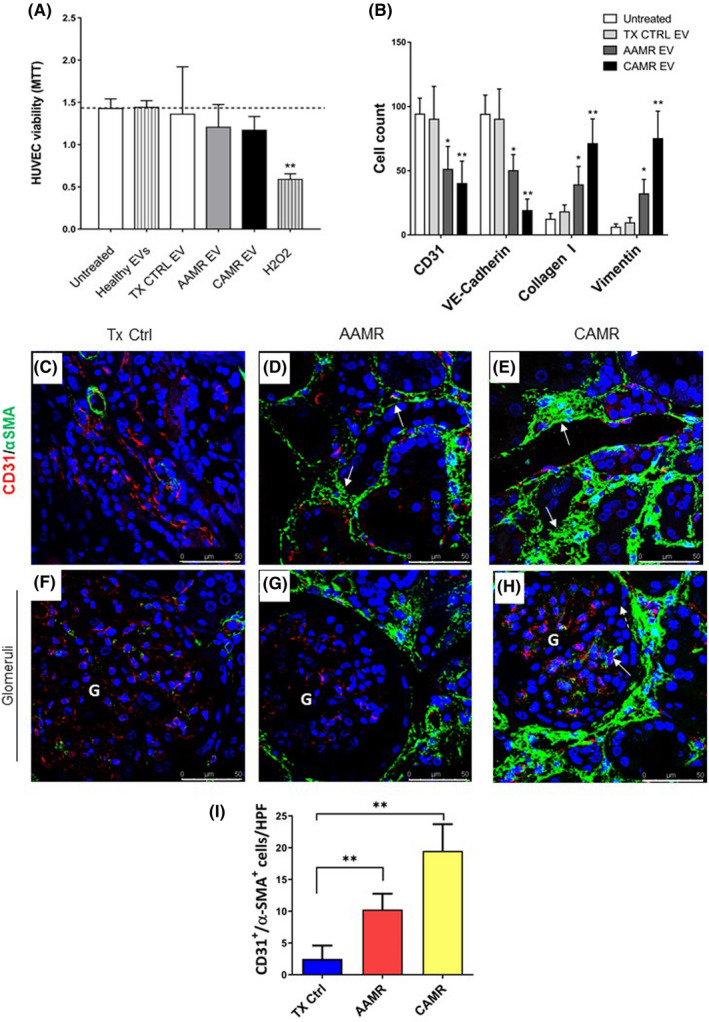
AMR patients‐derived EV induced EndMT in vitro, in vivo EndMT was observed in renal biopsies of the same patients. Primary endothelial cells (HUVEC) were incubated with healthy volunteers EV, control transplant patients EV, and AMR‐derived EV (5e+4 EV/cells target for 24 and 48 h). (A) MTT assay performed on HUVEC plated in 96‐well plate, treated with EV purified from plasma of AMR patients for 24 h. Untreated cells (indicated as basal), cell exposed to healthy control EV and H2O2 (up to 0.5 mM) were used as controls. Data represent the mean ± SD; n = 3. (B) Flow cytometry analysis showed a significant reduction of constitutive endothelial markers CD31 and VE‐cadherin and an increased expression of dysfunctional fibroblast‐like markers collagen I and vimentin after 48 h of treatment (representative plot are shown in Figure S2). Data are shown as median± interquartile range, *p value p < .05, **p value p < .01, Mann–Whitney test). (C–H) Analysis of EndMT on renal biopsies. Endothelial cells were double‐stained for the constitutive CD31 (green) and myofibroblast‐like α‐SMA marker (red) to investigate the occurrence of EndMT. (C) In control transplant biopsies, α‐SMA expression was limited to the wall of renal arteries and αSMA+ glomerular cells were barely detectable. (D) The tubule interstitium of acute and (E) chronic AMR biopsies showed an increased α‐SMA expression as indicated by white arrows. (H) In addition, strong and diffuse expression of α‐SMA was observed also in the glomerular capillaries of the biopsies with chronic AMR, lesser than in acute AMR (G). The fluorescent dye To‐pro 3 was used to counterstain nuclei (blue). (F–H) Glomeruli. (I) Quantitative analyses of CD31‐SMA double‐positive/high‐power (630×) fields (HPF) cells (were expressed as median ± interquartile range [IQR], n = 5). (p value as indicated, Mann–Whitney test). Magnification 630×