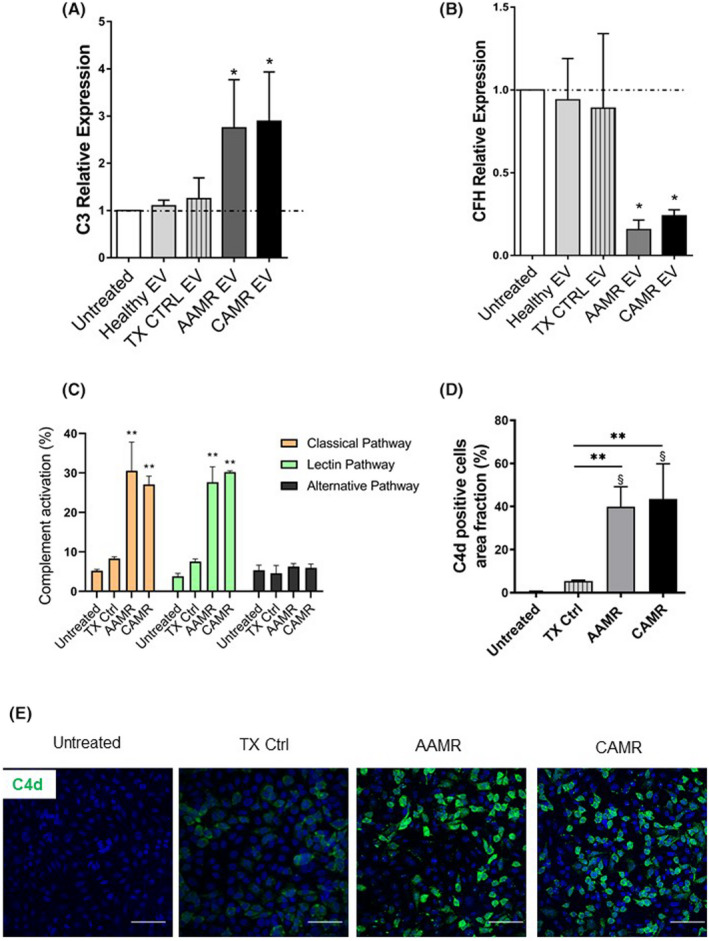
FIGURE 5.

Complement activation in tubular and endothelial cells culture after AMR‐derived EV exposition. (A, B) C3 and CFH gene transcript level in RPTEC after AMR‐derived EV stimulation (5e+4 EV/cells target for 24 h). Gene expression was assessed by qPCR and compared with normal untreated RPTEC cultured for 24 h. LPS, IFNγ and H2O2 exposed cells were used as positive control of C3 complement increase (not showed). Gene expression levels were normalized to the housekeeping gene β‐actin. Data are displayed as means ± SD, n = 5, one‐way ANOVA, *p < .05. (C) Primary human endothelial cells were cultured in serum‐free media, then exposed to EV 5e+4 EV/cells target for 24 h. (C) Complement activation in cells culture, supernatants were assessed by complement functional assay with a protocol adapted for cell culture, data are displayed as mean ± SD of percentage of complement activation compared with a positive control, medians were compared with a Mann–Whitney U test **p < .01, n = 5 per group. (D, E) Immunofluorescence analysis for C4d complement fragment. Endothelial cell grown in serum‐free conditions were exposed to AMR‐derived EV for 24 h (5e+4 EV/cells target) then labeled by immunofluorescence for C4d. Scale bar: 50 μm. Magnification, 630×. (D) Data are shown as mean ± SD and were analyzed by one‐way ANOVA test (n = 3 per group), *p < .01 versus TX Ctrl group, §p < .001 versus untreated cells.
