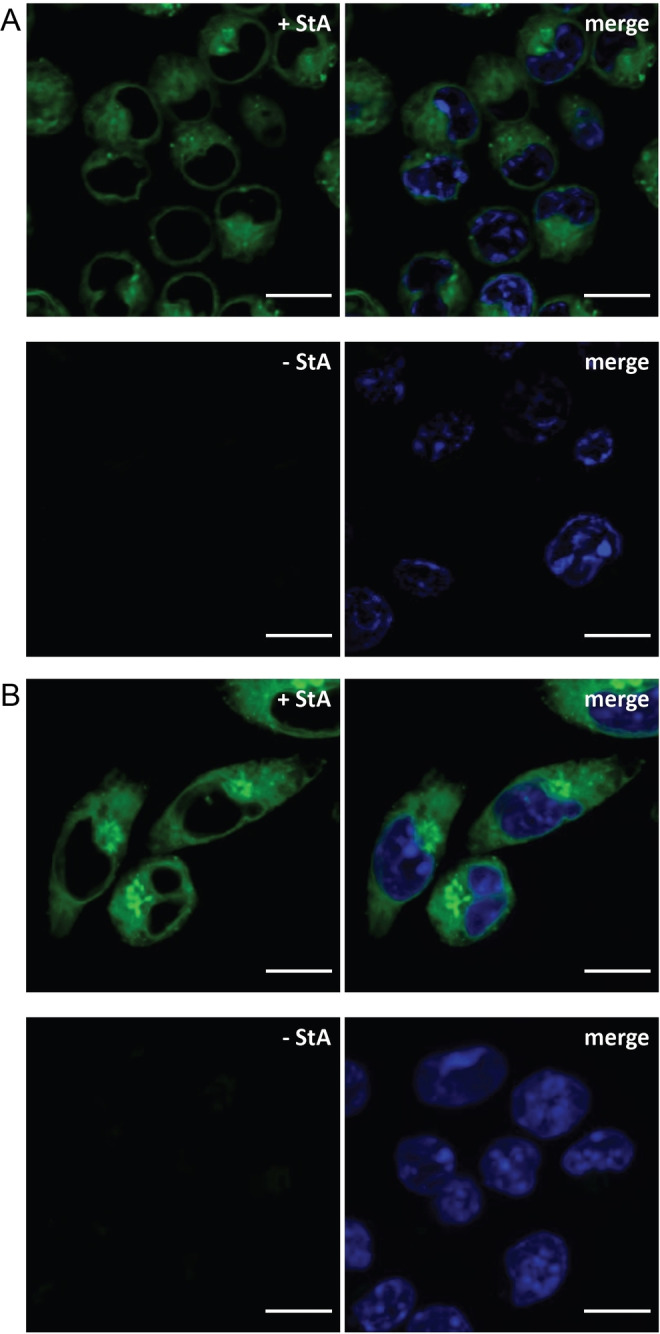
Figure 3.

Confocal imaging of DC2.4 cells incubated with 1 (+StA, 50 μM) or without the probe (‐StA). A) Live‐cell imaging of labelled cells visualised with 19 (5 μM). B) Fixed‐cell imaging of labelled cells visualised with 8 (5 μM). The samples were washed after metabolic incorporation of 1 and after ligation with the fluorophore‐tetrazines, and were imaged at >4 distinct locations in the same well. DNA was counterstained with Hoechst 33342 (blue) for reference. Scale bars represent 10 μm.
