Figure 5.
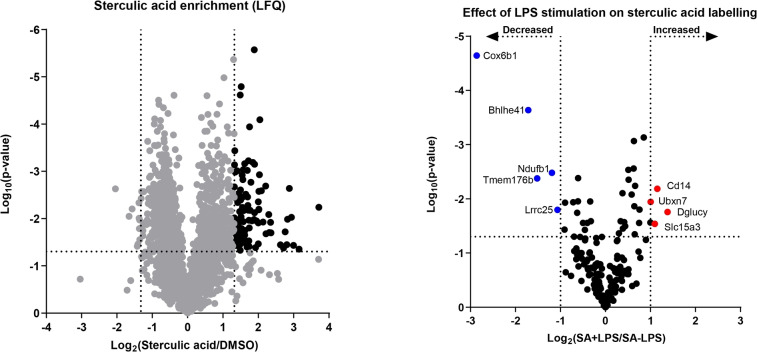
Proteomic analysis of proteins modified with 1 in DC2.4 cells by chemical proteomics. DC2.4 cells were stimulated with or without LPS (100 ng mL−1) for 24 h and treated with 1 (10 μM) for 20 h. Left: Volcano plot of proteins identified in pulldown experiment with 1 (10 μM) and biotin‐PEG4‐tetrazine (200 μM). Proteins with a ratio >2.5 and p‐value <0.05 are considered specifically enriched and are highlighted in black. Right: Difference in sterculic acid‐labeling of proteins between LPS‐ or vehicle‐treated DC2.4 cells. LFQ‐values of specifically sterculic acid‐enriched proteins were compared and proteins with significantly higher LFQ abundance between the two conditions are marked in red and blue for LPS‐ and vehicle‐treated conditions, respectively.

