FIGURE 4.

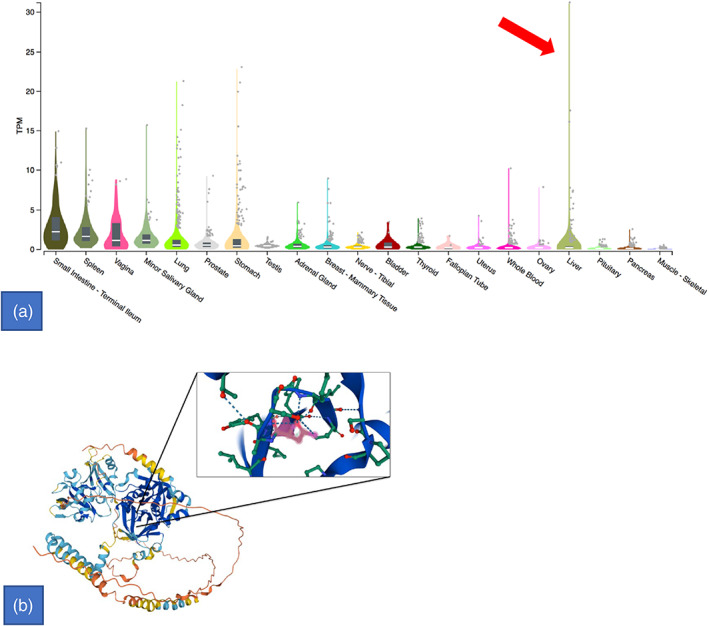
(a) Bulk tissue gene expression for FAM111B. Transcripts per million (TPM) concentration values' violin scale intensity plot (Y‐axis) broken out per all available tissue's transcriptomic analyses (X‐axis) shows outliers values in liver (red arrow). (b) FAM111B structure: tertiary and secondary structure with third predicted active protein site located at 650 amino acid residue showed in the magnification panel. Figure generated by using UniProt (Morgat A. et al., 2015; https://www.uniprot.org). Reference: Morgat, A., Lombardot, T., Coudert, E., Axelsen, K., Neto, T. B., Gehant, S., … & UniProt Consortium. (2020). Enzyme annotation in UniProtKB using Rhea. Bioinformatics
