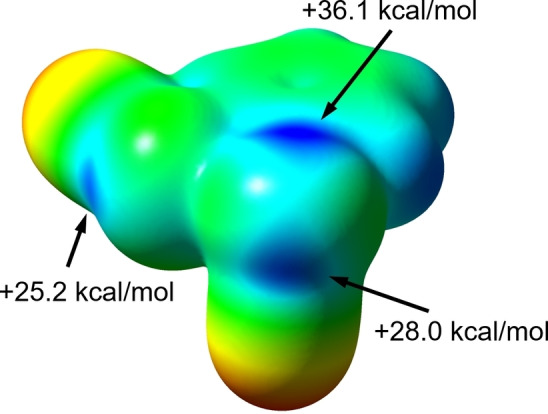
Figure 2.

Electrostatic potential (ESP) surface (plotted on the 0.002 e bohr−3 isosurface of the electronic density) for compound 1. Color range from −37.7 (red) to +43.9 (blue) kcal mol−1.

Electrostatic potential (ESP) surface (plotted on the 0.002 e bohr−3 isosurface of the electronic density) for compound 1. Color range from −37.7 (red) to +43.9 (blue) kcal mol−1.