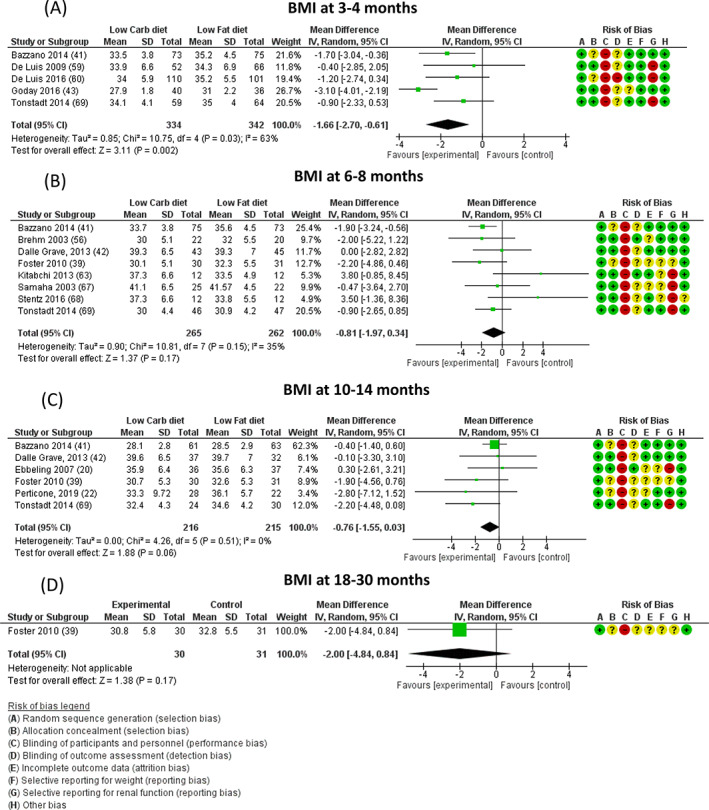
FIGURE 2.

Difference in body mass index (BMI, expressed as kg/m2) at A, 3‐4, B, 6‐8, C, 10‐14, and D, 18‐30 months between low‐carbohydrate (carb) and balanced carb diets. Risk of bias legend: A = random sequence generation (selection bias); B = allocation concealment (selection bias); C = blinding of participants and personnel (performance bias); D = blinding of outcome assessment (detection bias); E = incomplete outcome data (attrition bias); F = selective reporting for weight (reporting bias); G = selective reporting for renal function (reporting bias); H = other bias. “+” = low risk; “?” = unknown risk; “‐” = high risk. CI, confidence interval; MD, mean difference; N, number
