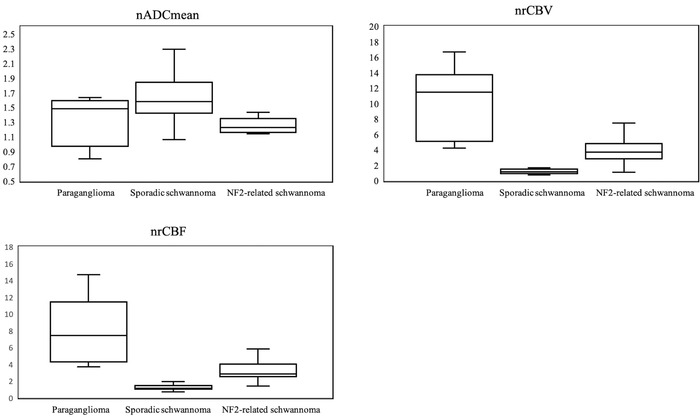
FIGURE 4.

Box‐and‐whisker plots of nADC, nrCBV, and nrCBF with Kruskal‐Wallis H test and post hoc test with Bonferroni correction are shown. Boundaries of boxes represent 25th and 75th percentiles, and lines in boxes indicate medians. nADCmean, normalized mean apparent diffusion coefficient; nrCBV, normalized relative cerebral blood volume; nrCBF, normalized relative cerebral blood flow
