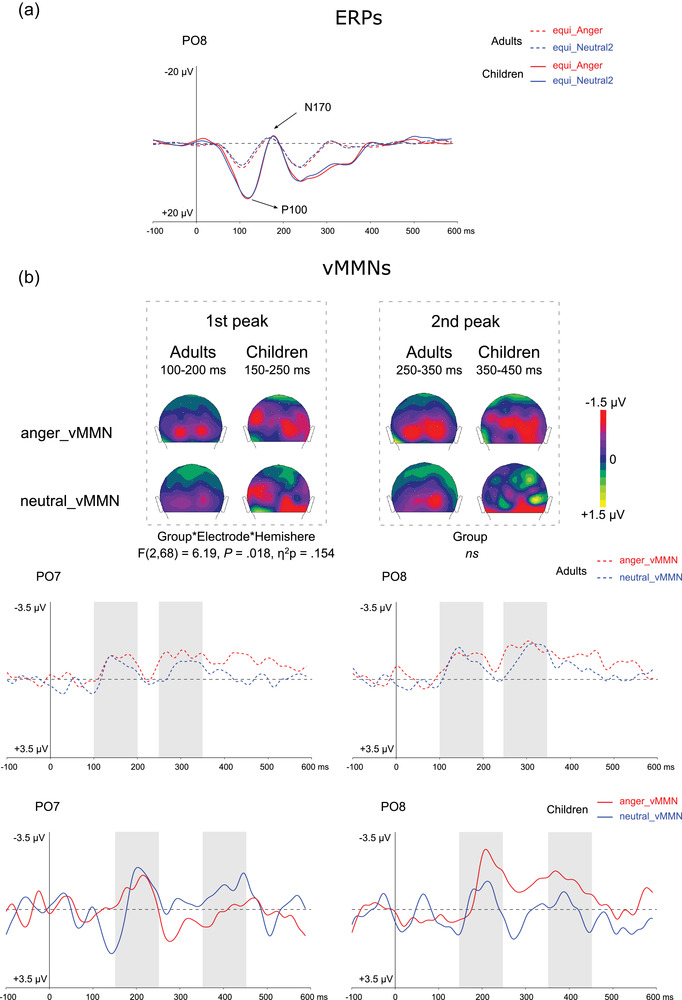
FIGURE 2.

(a) Grand average ERPs at PO8 elicited by emotional (anger, red lines) and neutral (blue lines) stimuli presented in the equiprobable sequence for adults (dotted lines) and for children (plain lines). P1 and N170 components are indicated by arrows. (b) On the top, two‐dimensional scalp topographies (back view) showing mean activity in selected time windows for each group and condition. On the bottom, grand average vMMN at PO7 and PO8 elicited by emotional (angry, red lines) and neutral (blue lines) deviants for adults (dotted lines) and for children (plain lines). Gray rectangles represent the time windows in which peak selection was applied for the first and second peaks measurement.
