
FIGURE 3.
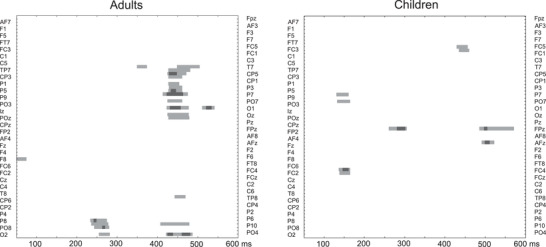
Permutation tests analyses showing statistical significance over the entire scalp (64 electrodes, left electrodes on the top and right electrodes on the bottom) in the 50–600 ms latency range comparing vMMN conditions (anger vs. neutral in adults [left] and in children [right]). Statistical significance is represented by light gray and gray colors (p < .05 and p < .01, respectively). For a better readability, electrodes’ labels were presented alternately on left and right sides.