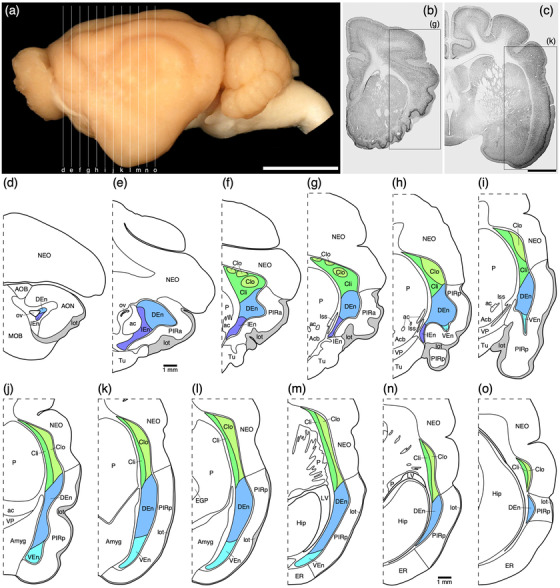
FIGURE 1.

(a) Photograph of the lateral surface of the brain of the tree pangolin showing the levels at which the coronal sections imaged (b, c) and reconstructed (d–o) were taken. Scale bar in (a) = 1 cm and applies to (a) only. (b, c) Photomicrographs of coronal sections through the tree pangolin telencephalon, taken at the levels corresponding to (g) and (k) in (a), showing examples of the regions that were magnified and reconstructed (boxed regions), in these two cases diagrams (g) and (k) specifically. Scale bar in (c) = 3 mm and applies to (b) and (c). (d–o) Diagrammatic reconstructions delineating the claustrum and endopiriform nuclear complex of the tree pangolin. In all diagrams, dorsal is to the top and medial to the left. Diagram (d) represents the most rostral section drawn, while diagram o represents the most caudal section. Each diagram is approximately 1000 µm apart. The various nuclei or subdivisions of the claustrum and endopiriform nuclear complex are represented with differing colors, while the lateral olfactory tract is represented in gray. See list for abbreviations
