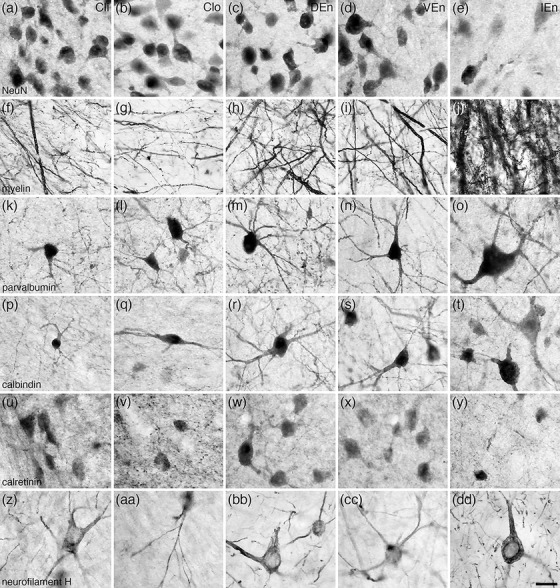
FIGURE 4.

High magnification photomicrographs of coronal sections through the tree pangolin brain showing the architectural appearance of the nuclei forming the claustrum and endopiriform nucleus, including the inner division of the claustrum (Cli, a, f, k, p, u, z), the outer division of the claustrum (Clo, b, g, l, q, v, aa), the dorsal endopiriform nucleus (DEn, c, h, m, r, w, bb), the ventral endopiriform nucleus (VEn, d, i, n, s, x, cc), and the intermediate piriform nucleus (IEn, e, j, o, t, y, dd) nuclei stained for neuronal nuclear marker (NeuN, a‐e), myelin (f‐j), parvalbumin (k‐o), calbindin (p‐t), calretinin (u‐y), and neurofilament H (z‐dd). Note the variations in structural densities between the nuclei, which can be consistently employed to determine the extent of each of these nuclei. In all photomicrographs, medial is to the left and dorsal to the top. Scale bar in (dd) = 20 µm and applies to all
