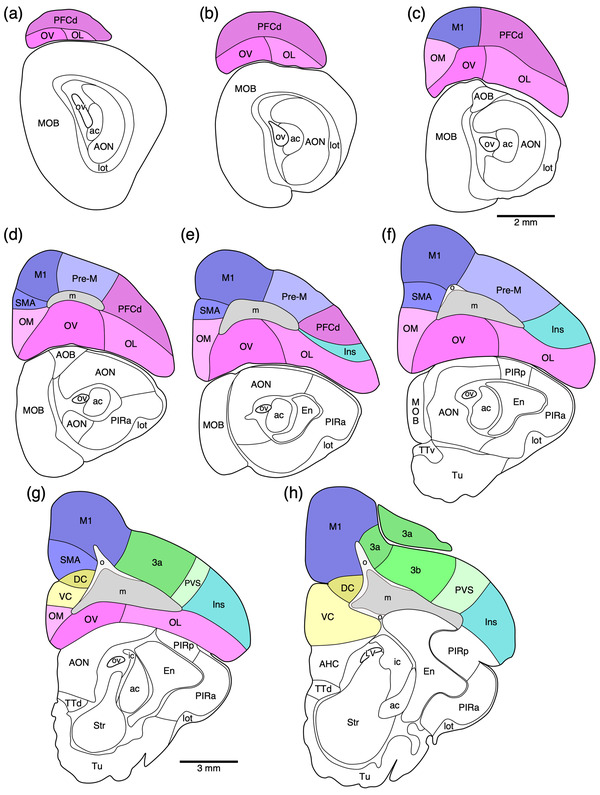
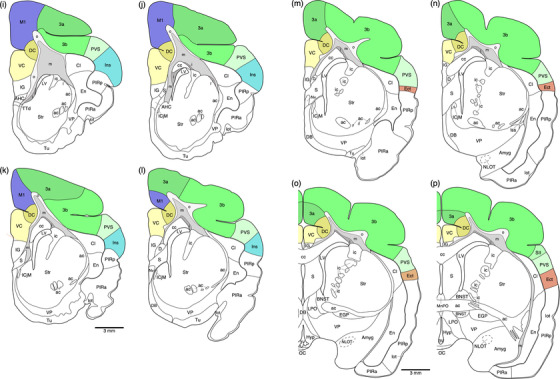
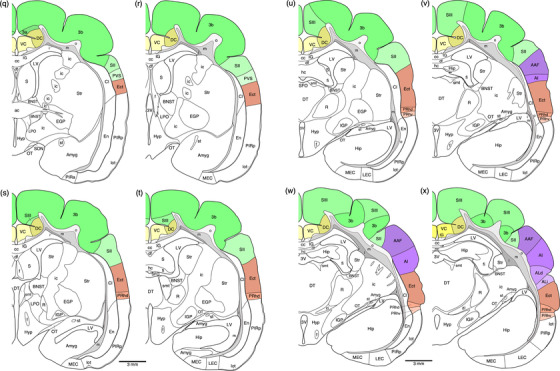
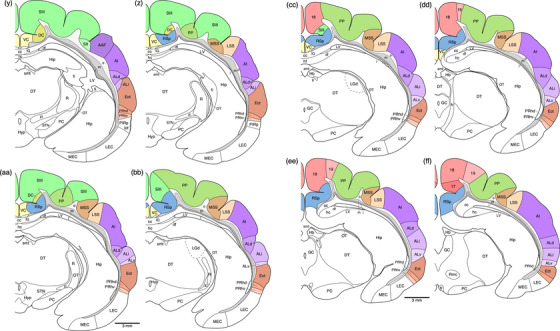
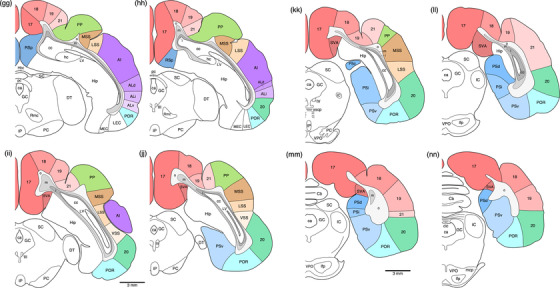
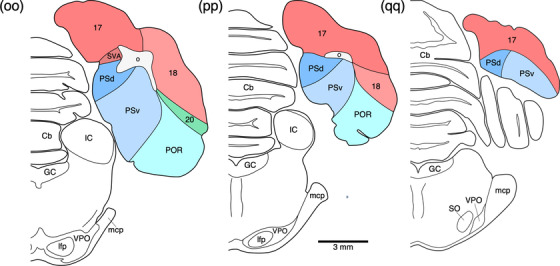
FIGURE 6.
Diagrammatic reconstructions of coronal sections through the tree pangolin brain delineating the identified cortical areas and certain other subcortical structures. In all diagrams, dorsal is to the top and medial to the left. Diagram a represents the most rostral section drawn, while diagram qq represents the most caudal section. Each diagram is approximately 500 µm apart. The various cortical areas are represented with differing colors, with shades of the same colors identifying cortical regions. The layers of white matter are given in different shades of gray. See list for abbreviations
