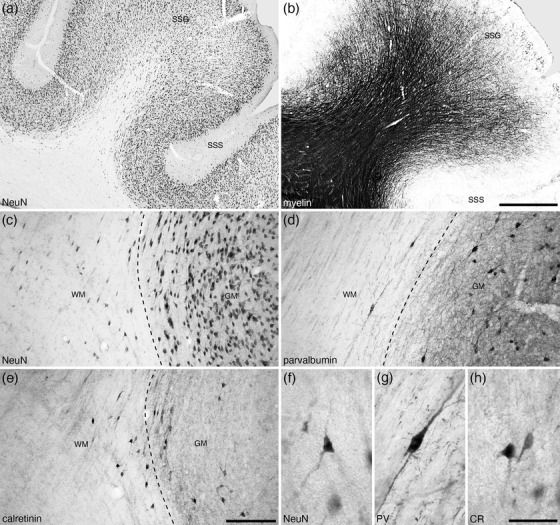
FIGURE 7.

Photomicrographs, taken at various magnifications, of coronal sections through the cerebral cortex and underlying white matter of the suprasylvian gyrus (SSG) and sulcus (SSS) of the tree pangolin brain stained for neuronal nuclear marker (NeuN, a, c, f), myelin (b), parvalbumin (d, g), and calretinin (e, h), showing the distribution and density of the white matter interstitial cells (WMICs). Dashed lines in (c), (d), and (e) demarcate the approximate border between the cortical gray matter (GM) and the underlying white matter (WM). Note the presence of several WMICs in the white matter (a, c), some of which are parvalbumin‐immunoreactive (d) and many more of which are calretinin‐immunoreactive (e). In all photomicrographs, medial is to the left and dorsal to the top. Scale bar in (b) = 1 mm and applies to a and b. Scale bar in (e) = 200 µm and applies to c–e. Scale bar in (h) = 50 µm and applies to f–h
