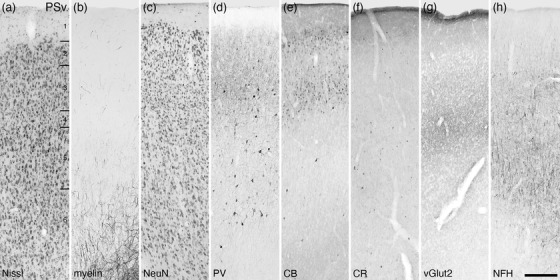
FIGURE 30.

Photomicrographs of the ventral area of the postsplenial cortical region (PSv, a‐h) of the tree pangolin. Note the different distribution and presence of structures stained for myelin, vGlut2, and NFH in comparison to the adjacent postsplenial areas (see Figure 24). All conventions, scale bar, and abbreviations as in Figure 10
