FIGURE 7.

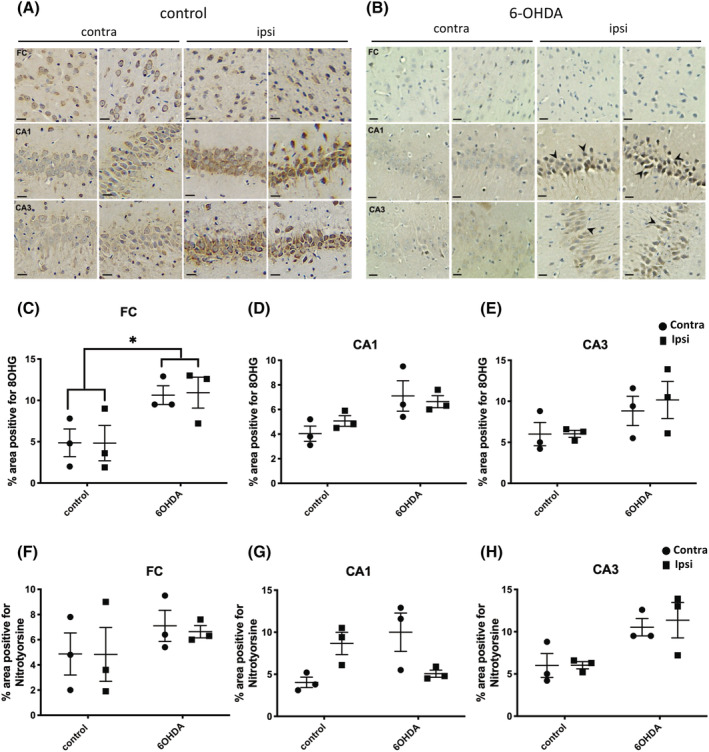
6‐OHDA injection induced a widespread oxidative stress response; 7 μm sections from control and 6‐OHDA‐injected rats, 3 weeks post‐injection, were immunolabelled using antibodies raised against (A) anti‐8‐hydroxyguanosine (8OHG) to detect damage in DNA/RNA and (B) nitrotyrosine to indicate nitrative damage. Regions of the brain shown include frontal cortex and hippocampal subfields, CA1 and CA3, both contralateral (contra) and ipsilateral (ipsi) hemispheres. Scale bar 20 μm. Graph shows quantification of the % area positive for 8OHG in (C) frontal cortex (Fc), (D) CA1 and (E) CA3, and for nitrotyrosine in (F) Fc, (G) CA1 and (H) CA3. Unpaired t tests were used to determine differences in immunoreactivity between control and 6‐OHDA groups for either the contralateral or ipsilateral hemisphere and showed a statistically significant increase in 8OHG in the Fc. No other differences between groups were found. *p < 0.05. Data are mean ± SEM, n = 3.
