
Figure 7.
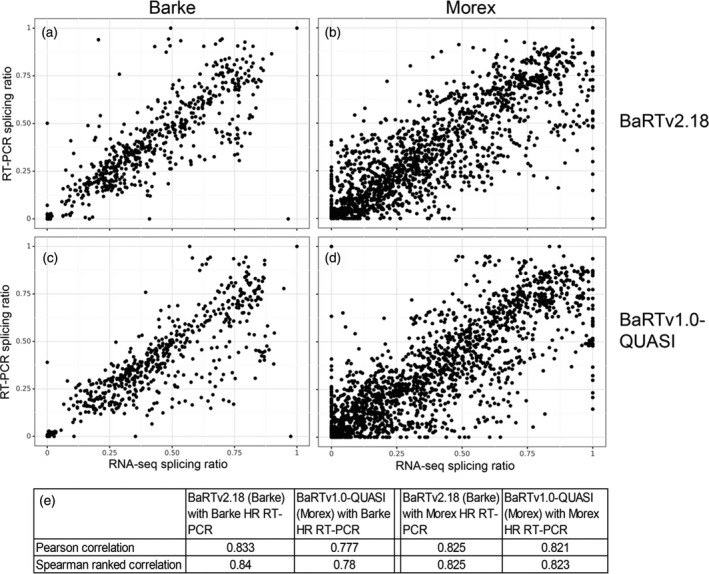
Comparison of accuracy of transcript quantification using BaRTv2.18 and BaRTv1.0‐QUASI measured by correlation of splicing ratios from high‐resolution (HR) reverse transcriptase‐polymerase chain reaction (RT‐PCR) and RNA‐seq.
Splicing ratios were calculated for multiple alternative splicing (AS) events from different genes from relative fluorescence units from HR RT‐PCR and transcript abundances (TPM) from RNA‐seq data were quantified with Salmon. (a and b) BaRTv2.18 was used to calculate splicing ratios from RNA‐seq data from 12 samples of Barke and 15 samples of Morex RNA and compare these with splicing ratios from HR RT‐PCR using 42 and 85 primer pairs, respectively, from the same RNA samples. (c and d) The same was carried out using BaRTv1.0‐QUASI. Pearson and spearman correlations for each of the combinations are shown (e).