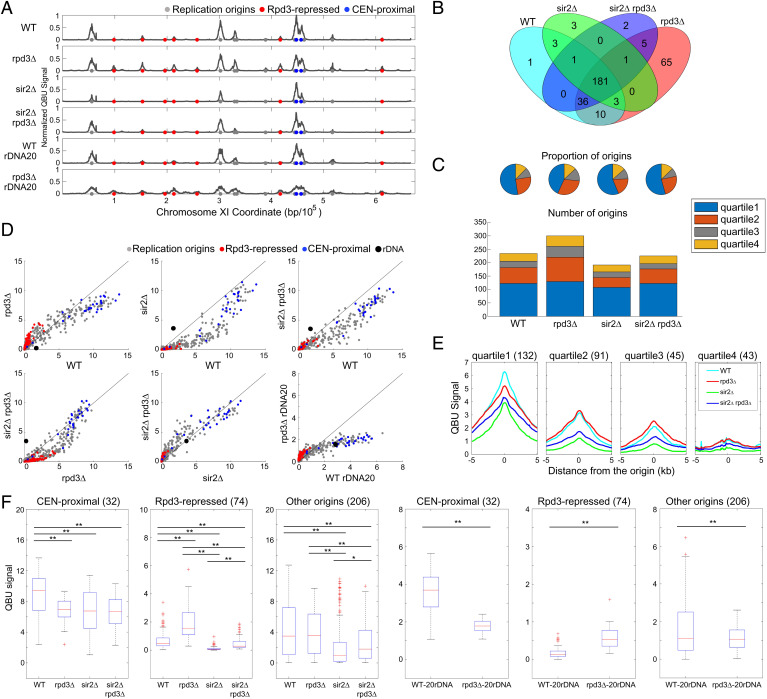
Fig. 1.
Rpd3 and Sir2 have different effects on single-copy origins. Strains CVy43 (WT), CVy44 (rpd3Δ), YHy3 (sir2Δ), and YHy6 (sir2Δ rpd3Δ) were synchronized in G1 phase and released into S phase without HU for DNA content analysis (SI Appendix, Fig. S1A) or with HU for 60 min for QBU analysis. Strains with reduced rDNA copies PP1758 (WT rDNA20) and JPy115 (rpd3Δ rDNA20) were synchronized in G1 phase and released into S phase for 120 min in the presence of HU for QBU analysis. (A) QBU values averaged for three replicates and scale normalized across strains are shown for representative chromosome XI; origins and origin subgroups are indicated with color-coded circles below the x axis. (B) Venn diagrams depicting overlaps between origins identified as active in each strain; the union of 311 origins detected was used in subsequent analyses. (C) Origin distributions according to TRep quartiles shown as pie charts with proportions of identified origins in each strain and as stack graphs showing total counts of origins identified in each TRep quartile. (D) 2D scatter plots comparing QBU signals for 500-bp regions centered on 311 individual origins plus the rDNA origins, which are represented by two (overlapping) data points; origins and subgroups are color coded as indicated. (E) Average QBU signals for 311 origins according to their TRep quartile assignments. (F) Box plot distributions of QBU counts for 500-bp regions aligned on origins of the indicated subgroups; n of origins in each group is indicated within parentheses; two-sided t tests were performed on all pairs of strains, and significant results are indicated as *P < 0.05 and **P < 0.01.

