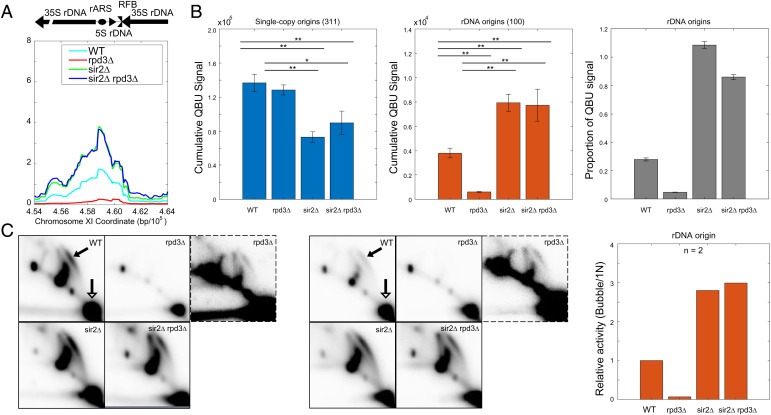
Fig. 2.
SIR2 deletion is epistatic to RPD3 deletion for rDNA origin firing. See Fig. 1 legend for strains and experimental description. (A) Average QBU signal for the rDNA depicted as a single locus. (B) Cumulative (+/−SD) QBU signal (500-bp windows) for 311 single-copy origins (Left panel) and 100 rDNA origins (Center panel) was determined and plotted; two-sided t tests were performed on all pairs of strains, and significant results are indicated as *P < 0.05 and **P < 0.01. Total QBU signal associated with rDNA origins was divided by total QBU signal associated with 311 single-copy origins plus the rDNA origins (Right panel). (C) 2D gel electrophoresis analysis probing for the rDNA was performed on the strains as described above. Two replicate sets are shown; the images framed with broken lines are darker images of the corresponding rpd3Δ image in each set. The arrows in the WT panels indicate the bubble arcs (filled arrowhead) and 1N spots (unfilled arrowhead) that are used for quantification (see SI Appendix, Fig. S2B for images with exact areas measured for quantification). The graph indicates quantification of the 2D gels by measuring intensity of “bubble arcs” in relation to the corresponding 1N spots; values are relative to WT arbitrarily set to 1.

