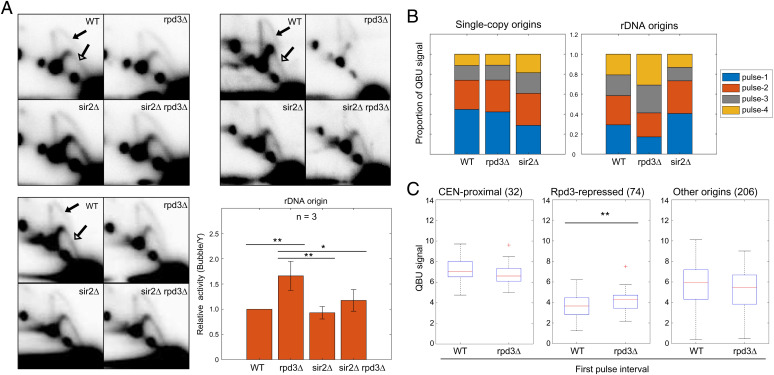
Fig. 3.
Rpd3 suppresses rDNA origin firing. (A) Strains described in Fig. 1 legend were grown logarithmically and harvested for 2D gel analysis and probing for the rDNA. Three replicate sets are shown. The arrows in the WT panels indicate the bubble arcs (filled arrowhead) and early Y-arcs (unfilled arrowhead) that are used for quantification (see SI Appendix, Fig. S3A for images with exact areas measured for quantification). The graph shows quantification of the 2D gels by measuring intensity of bubble arcs in relation to the corresponding Y-arcs (replication fork structures); values are relative to WT arbitrarily set to 1; two-sided t tests were performed on all pairs of strains, and results are indicated as *P < 0.05 and **P < 0.01. (B) WT, rpd3Δ, and sir2 strains described above were synchronized in G1 phase, released into S phase, and incubated with BrdU for the following time intervals for QBU analysis: pulse 1 = 15–30 min, pulse 2 = 25–40 min, pulse 3 = 35–50 min, and pulse 4 = 45–60 min; 5-min overlap is included to account for lag time in BrdU entry to cells and incorporation into DNA. The stack graphs show total QBU signal for 625 potential single-copy origins (Left) and total QBU signal for all rDNA origins during each time interval. (C) Box plot distributions of QBU signals (500-bp regions) in the first pulse interval of the time course for the indicated origin groups.

