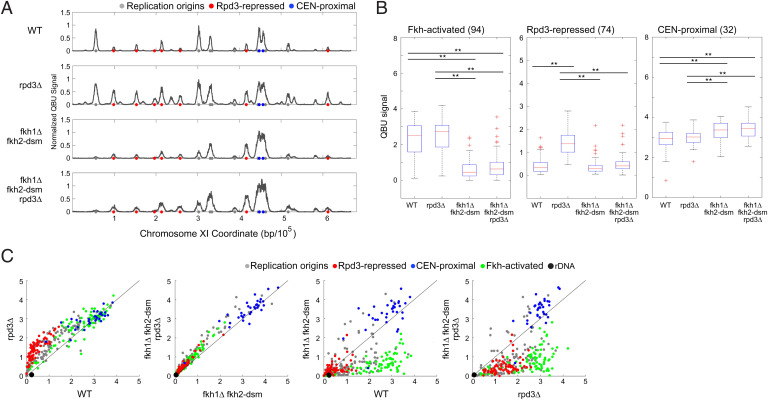
Fig. 4.
Origin derepression in rpd3Δ cells requires Fkh1/2. Strains CVy43 (WT), CVy44 (rpd3Δ), OAy1114 (fkh1Δ fkh2-dsm), and YHy13 (fkh1Δ fkh2-dsm rpd3Δ) were synchronized in G1 phase and released into S phase with HU for 90 min for QBU analysis. (A) Average QBU values are shown for representative chromosome XI; origins and origin subgroups are indicated with color-coded circles below the x axis. (B) Box plot distributions of QBU counts for 500-bp regions aligned on origins of the indicated subgroups; n of origins in each group is indicated within parentheses; two-sided t tests were performed on all pairs of strains, and results are indicated as *P < 0.05 and **P < 0.01. (C) 2D scatter plots comparing QBU signals centered on 311 individual origins plus the rDNA origins represented by two (overlapping) data points; origins and subgroups are color coded as indicated.

