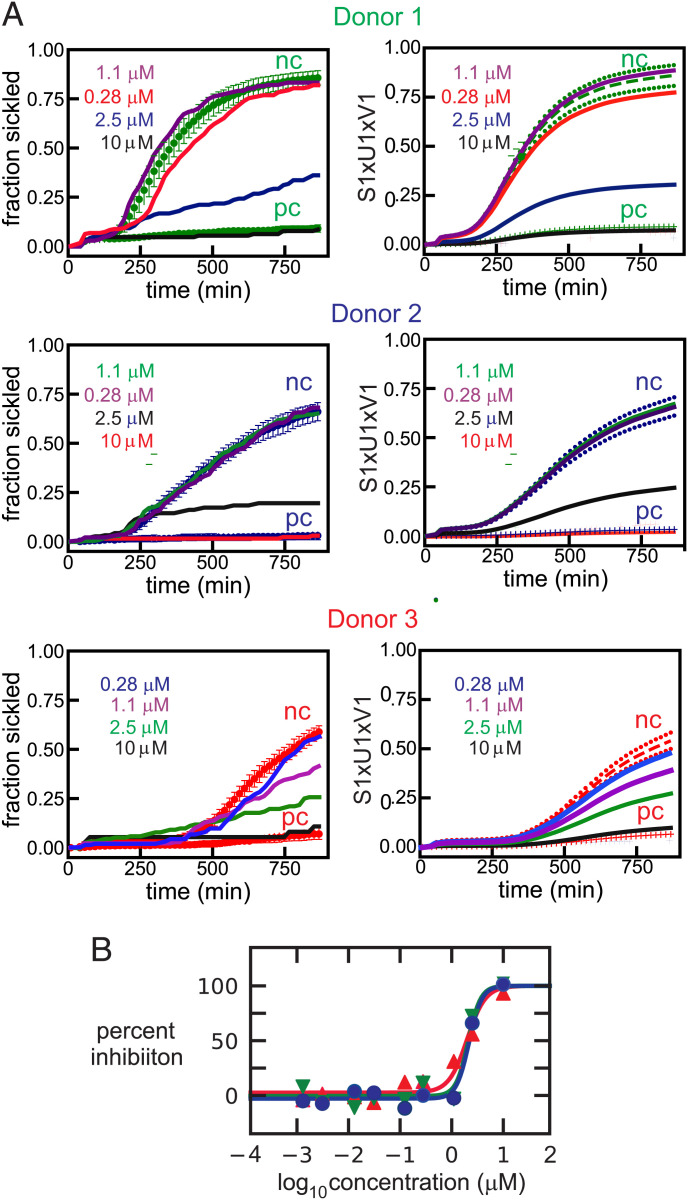
Fig. 2.
Nonrepresentative dose-response data for ReFRAME compound calcimycin, an antibiotic. (A) Time course of the fraction sickled following the start of deoxygenation with nitrogen to induce HbS polymerization and sickling. Sickling curves are shown at four different concentrations of calcimycin. Panels on the left are the measured sickling curves, while panels on the right show the curves constructed using only the first component of the SVD. The continuous curves in both left and right panels are the sickling curves for the single wells containing the test compound. The three colors represent samples from three different sickle trait donors with Hb compositions as percentage of total Hb: donor 1: HbA 56.0, HbS 38.0, HbA2 4.0, HbF 1.2, MCHC 34.2 g/dL; donor 2: HbA 62.7, HbS 33.7, HbA2 3.5, HbF <1.0, MCHC 28.6 g/dL; donor 3: HbA 59.7, HbS 37.8, HbA2 3.8, HbF <1.0, MCHC 26.6 g/dL. In the left panels, the upper points are the average for 12 negative controls (no compound) and SDs from the average, while the lower points are the average for 6 positive controls (osmotically swollen cells) and SDs from the average. In the right panels, the dashed curves are the average sickling curves (S1 × U1 × V1) of the negative controls with SDs indicated by the dotted curves. The lower points and vertical bars are the average and SDs for the positive controls. The abbreviations nc and pc stand for negative control and positive control, respectively. (B) Points are measured percentage of inhibition defined by Eq. 1 for cells from 3 different donors, while the continuous curves are the fits to the data using Eq. 2 (see Materials and Methods section for equations).

