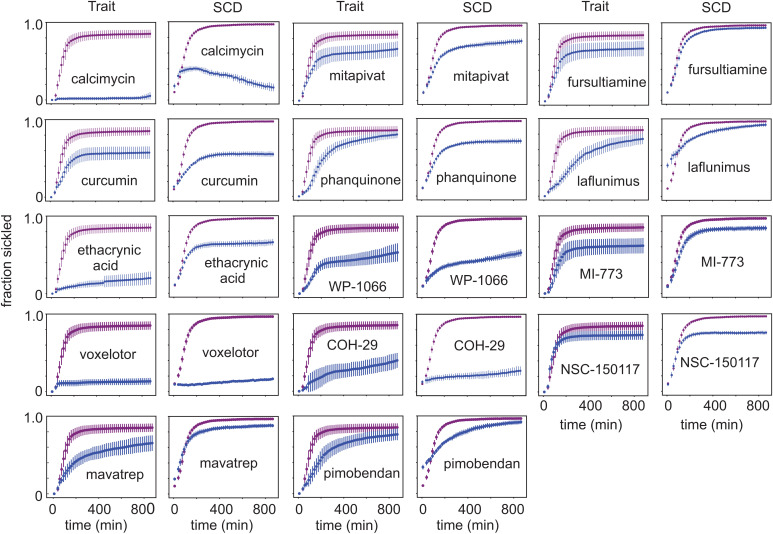
Fig. 4.
Comparing antisickling compounds in sickle trait and SCD cells. Fraction sickled versus time following deoxygenation to 0% oxygen for cells from sickle trait individual (HbA 56.1%, HbS 40%, HbA2 3.7%, HbF <1.0%, MCHC 29.5 g/dL) and deoxygenation to 5% oxygen for cells from SCD patient (HbS 91%, HbA2 4.2%, HbF 4.8%, MCHC 34.8 g/dL) incubated for 3 h at a concentration of 10 μM for 14 of the 106 antisickling compounds listed in Table 1. In all of the plots, the x axis runs from 0 to 900 min, and the y axis runs from 0 to 1, both with slight offsets from 0. The upper curves (purple) are negative controls; lower curves (blue) are for test compounds. The SDs are larger for trait cells because the average number of cells in the images was approximately twofold less than for SCD cells. The unusual sickling curve for SCD cells incubated with calcimycin suggests that fibers, which form, subsequently melt as the effect of the drug is increasing, presumably because of a volume increase large enough to result in an intracellular concentration less than the solubility.

