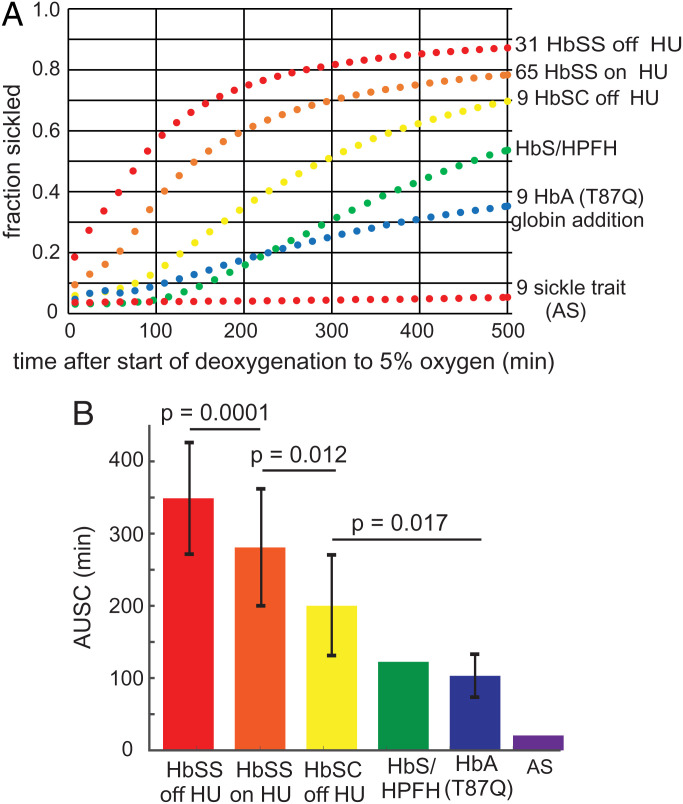
Fig. 6.
Average sickling curves for red cells from individuals with various sickle syndromes. (A) Sickling curves: the condition and number of samples are given next to each curve. The average compositions and MCHCs and SDs from the average for each condition are given in Table 2. (B) Histogram of average AUSCs, SDs, and the statistical significance probability (P values) using an unpaired, two-tailed t test with the program Prism. The SDs are almost entirely due to person-to-person difference, with very little contribution from experimental error.

