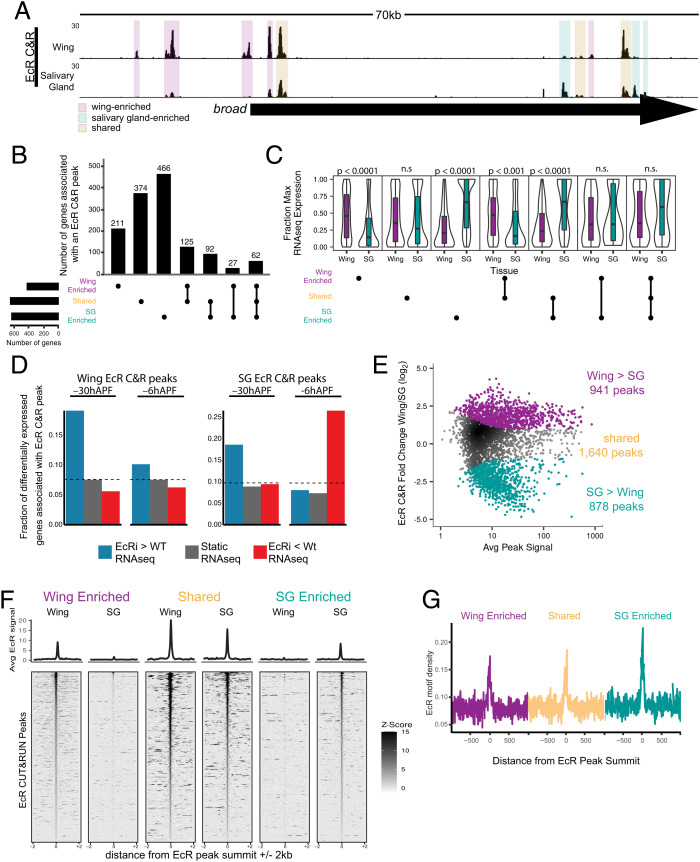
Fig. 3.
EcR binding is tissue-specific. (A) Browser shot of EcR CUT&RUN data from −6hAPF wings and salivary glands, with examples of wing-enriched, salivary gland enriched, and shared peaks highlighted by colored boxes. (B) Upset plot of the number of genes associated with at least one EcR CUT&RUN peak in each tissue, split by EcR peak category. Each EcR-bound gene is only represented once. (C) Violin plots of RNA-seq values (fraction of max) of genes bound by EcR in at least one tissue. P values represent comparisons between wing and salivary gland for each upset category (Wilcoxon rank-sum test with Bonferroni correction). (D) Bar plot of the fraction of differentially expressed EcR-bound genes in EcR-RNAi wings and salivary glands. The dotted lines indicate the fraction of all expressed genes in each EcR peak category. (E) MA plot depicting −6hAPF EcR wing and salivary CUT&RUN values in a union set of EcR CUT&RUN peaks. Differential peaks are indicated with colored dots. (F) Heatmaps and average signal plots of EcR CUT&RUN signal for wing-enriched, shared, and salivary gland-enriched peaks centered on peak summits. For shared peaks, the wing summit was used. (G) Line plots (10 bp bins) of EcR motif density +/−1 kb from EcR peak summits for the three EcR binding categories.

