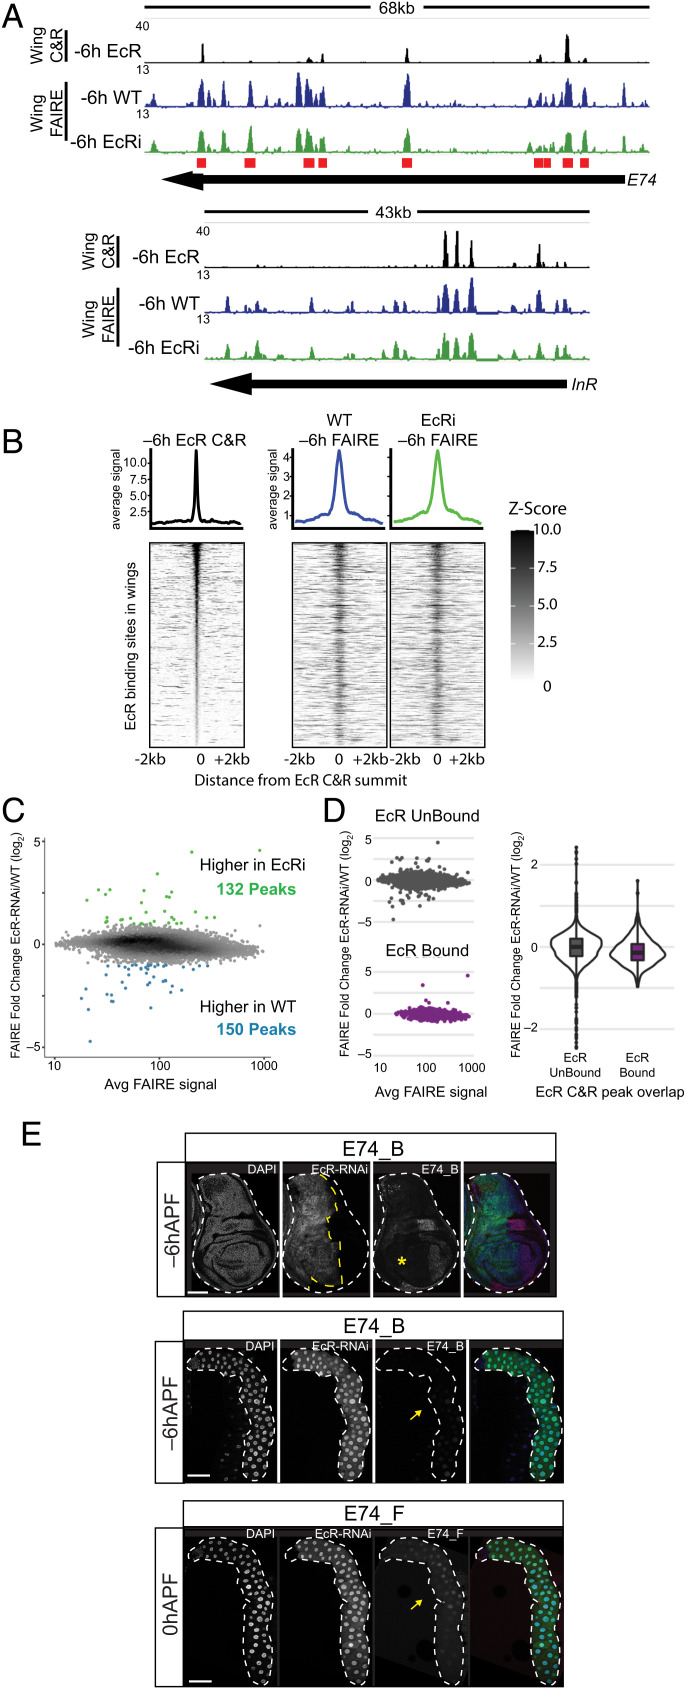
Fig. 5.
EcR loss of function has minimal impact on chromatin accessibility. (A) Browser shots of EcR CUT&RUN signal from −6hAPF wild-type wings, and FAIRE signal from −6hAPF wild-type and EcR-RNAi wings. Red boxes indicate the location of cloned regions from the E74 locus. (B) Heat maps and average signal plots of FAIRE signal in −6hAPF EcR CUT&RUN peaks from −6hAPF wild-type and EcR-RNAi wings. EcR CUT&RUN signal is shown on the left for reference. (C) MA plot of FAIRE signal in the union set of FAIRE peaks from −6hAPF wild-type and EcR-RNAi wings. (D) MA plots (Left) and violin plot (Right) of the FAIRE data shown in (C) separated according to their overlap with an EcR CUT&RUN peak. (E) Confocal images of E74_B activity (red) in −6hAPF wings (Top) and salivary glands (Middle), and E74_F activity in 0hAPF salivary glands (Bottom). Cells expressing EcR-RNAi are marked with GFP (green). The yellow asterisk and arrow indicate loss of enhancer activity in wings and glands, respectively. (Scale bars: 100 μm.)

