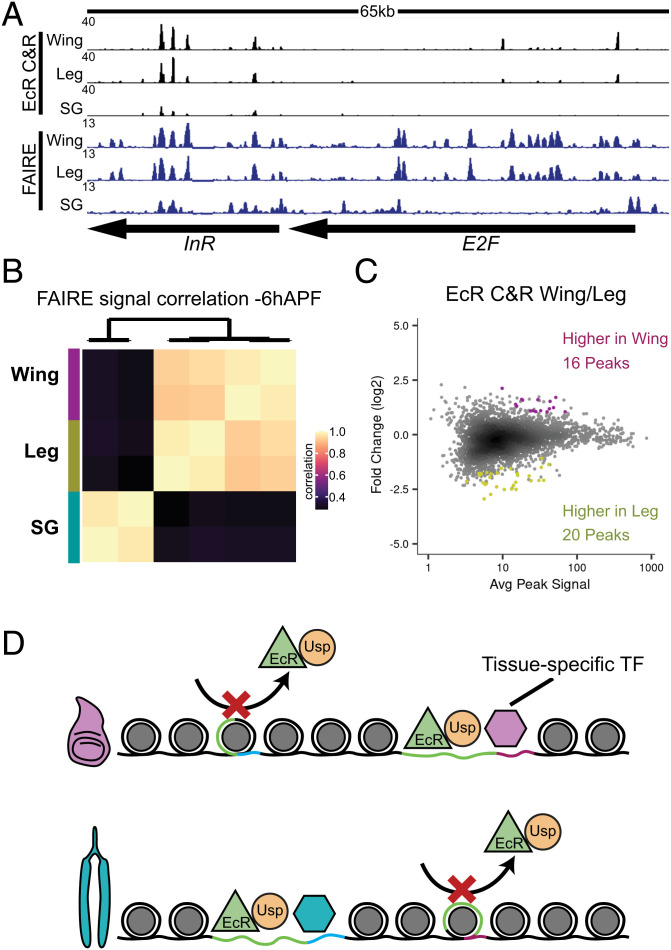
Fig. 6.
EcR binding profiles in legs and wings are more similar than those in salivary glands. (A) Browser shot of EcR CUT&RUN and FAIRE signal from −6hAPF wild-type wings, legs, and salivary glands. (B) Heatmap of the Pearson correlation coefficient for EcR CUT&RUN signal between tissues. (C) MA plot of EcR CUT&RUN signal between −6hAPF wild-type wings and legs. Differential peaks are indicated by colored dots. (D) Model depicting the dependence of EcR (green triangle) on tissue-specific transcription factors (hexagons) for DNA binding.

