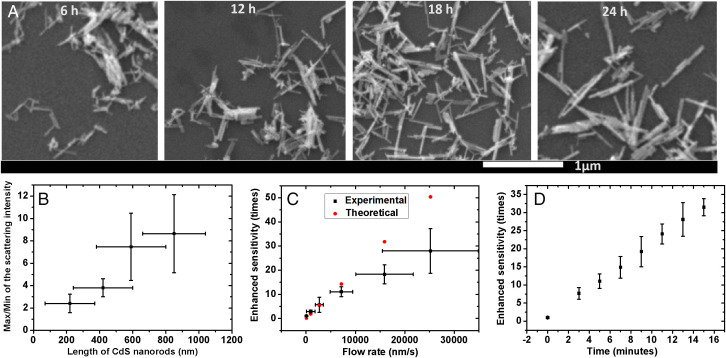
Fig. 2.
Structural heterogeneity reflected by scattering intensity and Sensitivity improved by screening time and flow rate. (A) SEM images of the CdS nanorods with different lengths by different reaction times (6, 12, 18, and 24 h). (B) Fluctuation of scattering intensity of CdS nanorods indicated by the maximum/minimum intensity value with different lengths. (C) Experimental- and theoretical-enhanced sensitivities with the increasing flow rates within 5 min. (D) Experimental-enhanced sensitivity with increasing screening times in a field of view of 150 × 150 μm with a flow rate of 7.1 μm/s. The concentration of particles is ca. 10−14 M.

