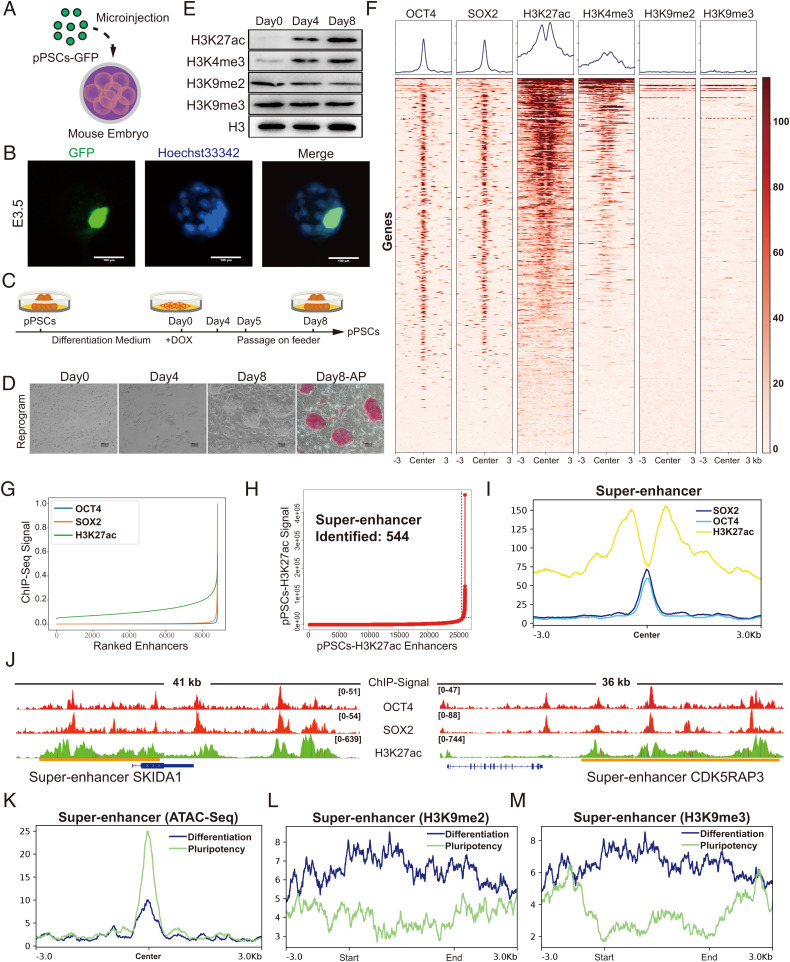
Fig. 1.
Systematic identification of SEs in porcine PSCs. (A) Schematic of the generation of pig-mouse ex vivo chimeric embryos. (B) Representative images of porcine PSC-injected mouse embryos cultured in vitro at E3.5. The nuclei were marked by Hoechst33342, and the location of the injected porcine PSCs was marked with GFP. Scale bar, 100 µm. (C and D) Strategies for switching porcine PSCs between pluripotent state and differentiation state by changing the culture condition. Under the reprogramming culture condition, differentiated porcine PSCs transformed to the pluripotent state (referred to as secondary reprogramming). Scale bar, 100 µm. (E) Western blot analysis of representative histone modifications during secondary reprogramming. (F) Heatmaps of OCT4, SOX2, H3K27ac, H3K4me3, H3K9me2, and H3K9me3 surrounding the OCT4 binding loci. (G) Distribution of H3K27ac, OCT4, and SOX2 normalized ChIP-seq signals. Each ChIP-seq data point was normalized by dividing the ChIP-seq signals by the maximum signals individually and was sorted in ascending order. (H) Identification of SEs in porcine PSCs. Within the 12.5-kb window, H3K27ac signals were ranked for porcine PSCs. The enhancers above the inflection point were defined as original SEs. (I) Average ChIP-seq signal density of OCT4, SOX2, and H3K27ac surrounding the center of the SE regions. (J) ChIP-seq signal profiles of OCT4, SOX2, and H3K27ac in porcine PSCs at two representative top-ranked SE loci. Gene models are shown below the binding profiles. The positions of SEs are marked by orange lines. (K) Average ATAC-seq signal density in the pluripotent state and differentiation state of porcine PSCs surrounding the SE regions. (L and M) Average ChIP-seq signal density of H3K9me2 and H3K9me3 in pluripotent and differentiation states of porcine PSCs surrounding the SE regions. DOX, doxycycline. pPSC, porcine pluripotent stem cell. E3.5, embryonic day 3.5.

