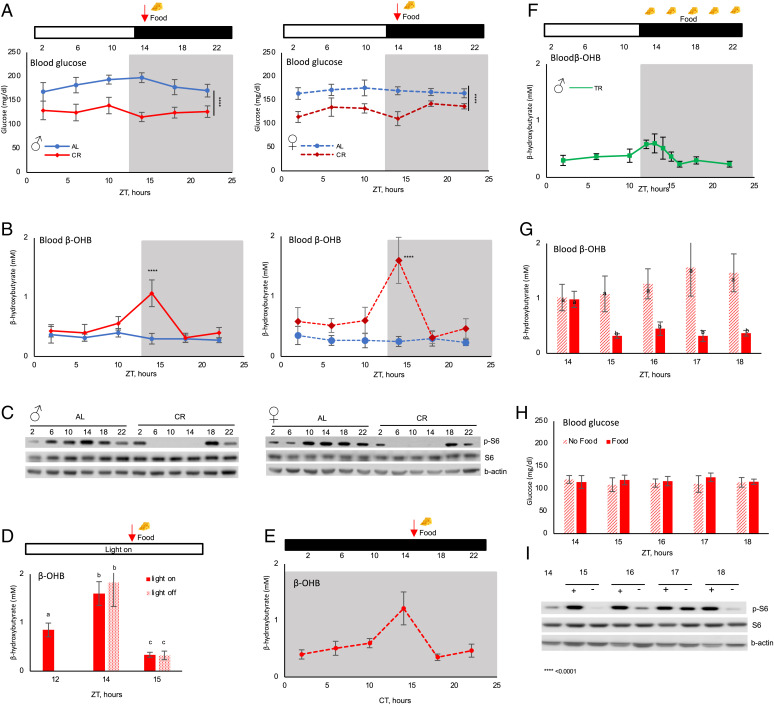
Fig. 1.
CR-induced circadian rhythms in blood βOHB. Around-the-clock blood glucose (A) and βOHB (B) in male (Right) and female (Left) mice. Mice were on AL (solid blue line) or 30% CR (dashed red line) diets. The food was provided to CR mice at ZT14 (indicated by arrow). n = 6 per time point per diet. (C) Western blotting for indicated proteins in the liver of AL and CR mice around the clock, pooled samples; n = 3 per diet per time point. (D) Blood βOHB when the light was not turned off at ZT12; n = 8 per time point. (E) Blood βOHB in CR mice that were placed in constant darkness for 48 h; n = 6–8 per time point. (F) Blood βOHB in TRF mice around the clock. The food was provided at ZT14 and removed at ZT2; n = 6 per time point. βOHB (G) and glucose (H) in the blood of CR mice that were provided (solid bars) or not provided (dashed bars) with the food at ZT14. Bars with different letters are statistically different from each other; n = 6. (I) Western blotting for indicated proteins in the liver of CR mice that were provided (+) or not provided (−) with the food; n = 3 per diet per time point. The light was on at ZT0 and off at ZT12. White and black bars represent light and dark. Gray panels on the graphs indicate the dark phase of the day. ZT is Zeitgeber Time, CT is Circadian Time. Significant difference between the diet, ****P < 0.0001, at indicated time point.

