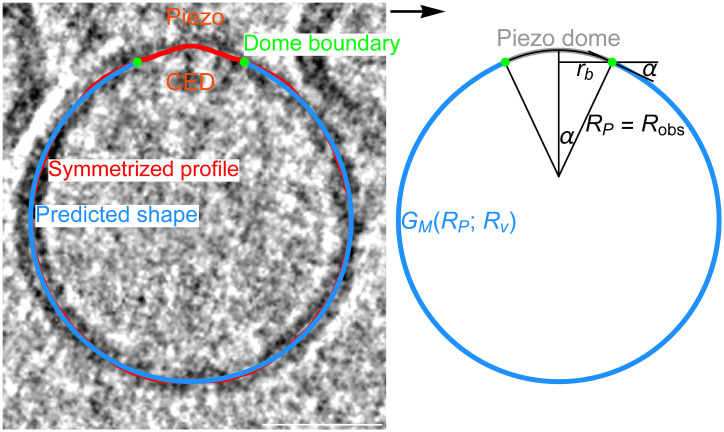
Fig. 1.
Predicting the shape of Piezo vesicles. Oriented Piezo vesicle image obtained by cryo-EM tomography (Left), associated symmetrized (measured) Piezo vesicle profile (red curve; Left), Piezo dome boundary obtained by integrating out a vesicle surface area equal to starting at the vesicle north pole (green dots; Left and Right), and corresponding predicted free membrane profile (blue curves Left and Right). The predicted Piezo vesicle profile is obtained, with no free parameters, from the membrane elasticity theory of Piezo vesicle shape described in our companion paper (10), and minimizes the Helfrich energy equation, Eq. 1. The value of the minimized free membrane bending energy, in Eq. 1, depends on the vesicle size, , and on the radius of curvature at the Piezo dome boundary, , with denoting the values of associated with the predicted free membrane shapes in figure 4 of our companion paper (10). We obtain from , where and denote the in-plane Piezo dome radius and the Piezo dome contact angle associated with the predicted free membrane shapes in figure 4 of our companion paper (10), respectively. The vesicle shown here corresponds to vesicle 6 with in figure 4 of our companion paper (10). CED marks the Piezo C-terminal extracellular domain (CED). (Scale bar, 26 nm.)

