Fig. 4.
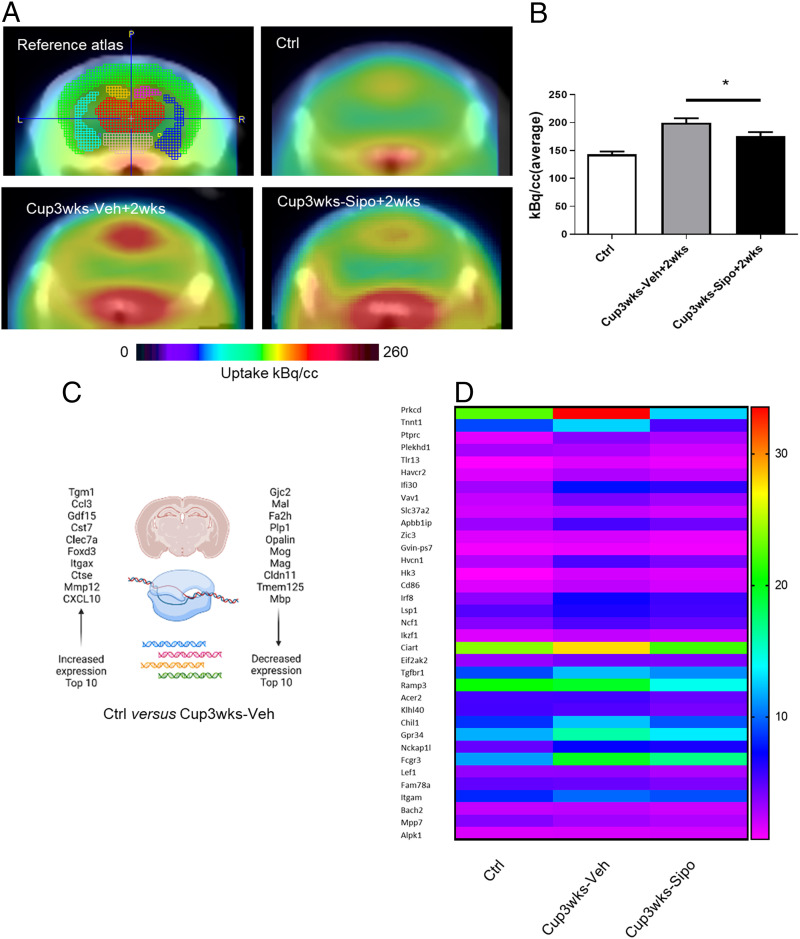
Protective effects of siponimod are evident by [18F]F-GE180 PET/CT measurements and next generation sequencing studies. (A) Schematic illustration of the evaluated areas and cumulative heat map illustrating radioligand uptake in control (n = 6), Cup3wks-Veh+2wks (n = 4) and Cup3wks-Sipo+2wks (n = 4) mice. The color codes demonstrate the standardized radioligand uptake levels relative to the control group. (B) Quantification of radioligand uptake. Statistical analyzes were performed by Mann–Whitney test as indicated. (C) Top 10 up-regulated and down-regulated genes in Ctrl versus Cup3wks-Veh mice. (D) Heat-map illustrating expression levels of the top 35 genes with lower expression in Cup3wks-Sipo versus Cup3wks-Veh mice. Control groups (Ctrl) are shown in addition. n = 5 animals per experimental group. Data are shown as mean ± SEM. *P < 0.05.

