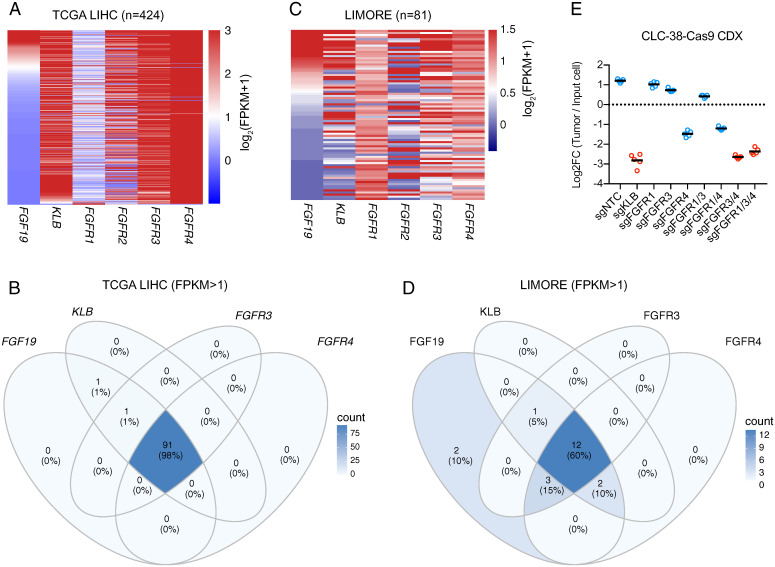
Fig. 6.
Prevalent coexpression of FGFR3 and FGFR4 in FGF19-positive HCC cases and cell lines. (A) Heat map depicting RNA expression levels of indicated genes in HCC cases from the TCGA LIHC dataset. (B) Venn diagram indicating TCGA LIHC cases coexpressing indicated genes (FPKM >1). (C) Heat map depicting RNA expression levels of indicated genes from the LIMORE cell line collection. (D) Venn diagram indicating LIMORE cell lines coexpressing indicated genes (FPKM >1). (E) Relative abundance (log2 transformed) of CLC38-Cas9 cells harboring indicated combinations of sgRNAs from subcutaneous tumor xenografts normalized to input cells. Bars represent averages from n = 5 nude mice. Comparisons among groups were performed with ordinary one-way ANOVA (F [8, 36] = 588.9; P < 0.000001) followed by Tukey multiple comparison test (P values in SI Appendix, Table S3).

