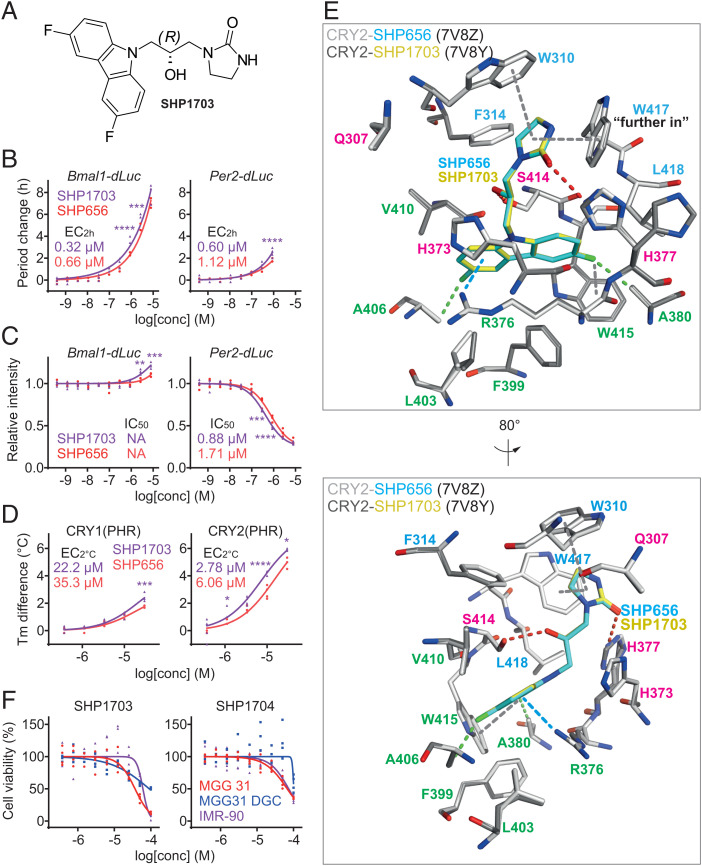
Fig. 4.
The R form of SHP656 is the active isomer. (A) The chemical structure of SHP1703, the R form of SHP656. (B and C) Effects of SHP1703 and SHP656 on circadian rhythms in Bmal1-dLuc and Per2-dLuc U2OS cells. Changes in period (B) and luminescence intensity (C) compared to a DMSO control are shown (n = 4 biologically independent samples). When arrhythmic, period is not plotted. Concentrations for 2-h period lengthening (EC2h) and 50% inhibition (IC50) are indicated. ****P < 0.0001; ***P < 0.001; **P < 0.01 relative to SHP656 by two-way ANOVA followed by Sidak’s multiple comparisons test. (D) Interaction with CRY1(PHR) and CRY2(PHR) in vitro. Changes in denaturing temperatures of recombinant CRY(PHR) proteins in the presence of various concentrations of compounds compared to a DMSO control are shown (n = 3 to 4 biologically independent samples). Concentrations for 2 °C stabilization (EC2 °C) are indicated. ****P < 0.0001; ***P < 0.001; *P < 0.05 relative to SHP656 by two-way ANOVA followed by Sidak’s multiple comparisons test. (E) Crystal structure of CRY2-SHP1703 (PDB ID: 7V8Y). Superposition of CRY2-SHP656 (white–cyan) and CRY2-SHP1703 (gray–yellow) indicated identical conformations and binding modes. A cation–π interaction is shown in blue dashed line; C–H interactions are shown in green dashed lines; F−π interactions, π−π stacking, and T-shaped stacking are shown in gray dashed lines; and H-bonds are shown in red dashed lines. Residues comprising hydrophobic region 1, the affinity region, and hydrophobic region 2 are colored blue, magenta, and green, respectively. H377 was flexible in both CRY2-SHP656 and CRY2-SHP1703 structures but was only modeled with an alternate conformation in CRY2-SHP1703. Lower is an 80° rotated view around the y axis with respect to Upper. (F) Effects of SHP1703 (Left) and SHP1704 (Right) on cell viability (n = 3 to 4 biologically independent samples). The 50% effective concentrations (EC50) are indicated in the main text. Statistical significance by two-way ANOVA followed by Tukey’s multiple comparisons test are summarized in SI Appendix, Table S2.

