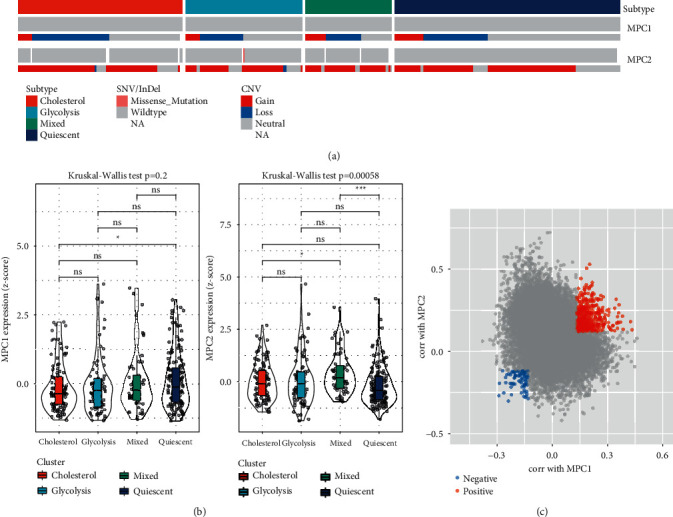
Figure 3.

Analysis of MPC complex among different subtypes in TCGA dataset. (a) Mutations and CNV distribution of MPC1 and 2 in different molecular subtypes. (b) Comparison of MPC1/2 expression among different molecular subtypes. (c) Scatter plot of genes associated with MPC1/2. Kruskal-Wallis test was performed among four groups. ns, no significance. ∗P < 0.05, ∗∗∗P < 0.001.
