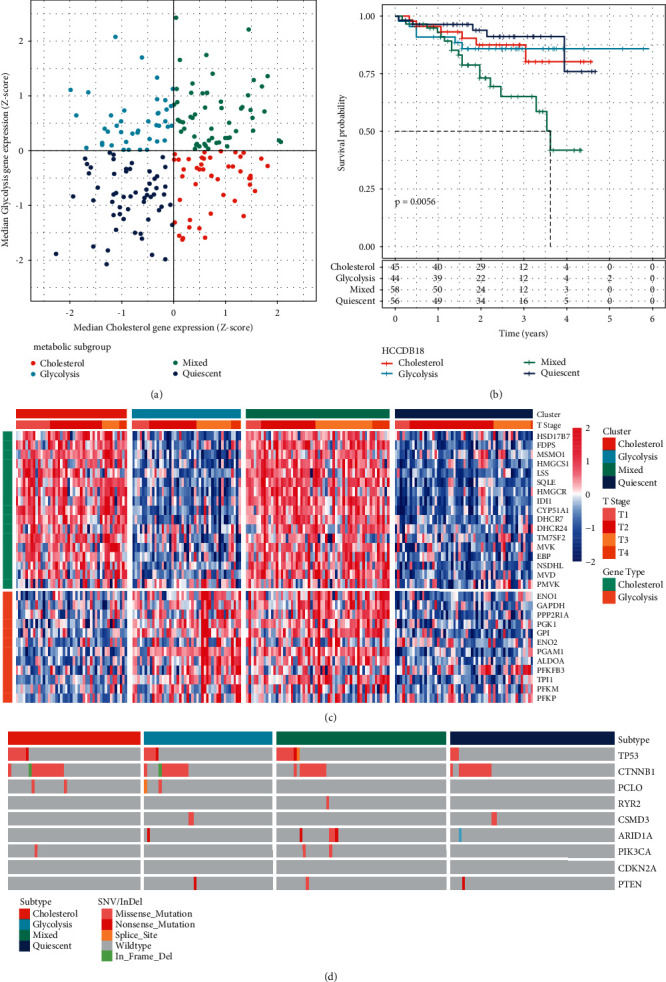
Figure 4.

Subtype validation in HCCDB18 dataset. (a) Classification of samples according to glycolysis/cholesterol synthesis-related gene expression levels. (b) Prognostic survival curve of molecular subtypes of HCCDB18 liver cancer in all samples. (c) Cluster heatmap of 29 related genes. (d) Mutation patterns of the top nine mutated genes in four molecular subtypes.
