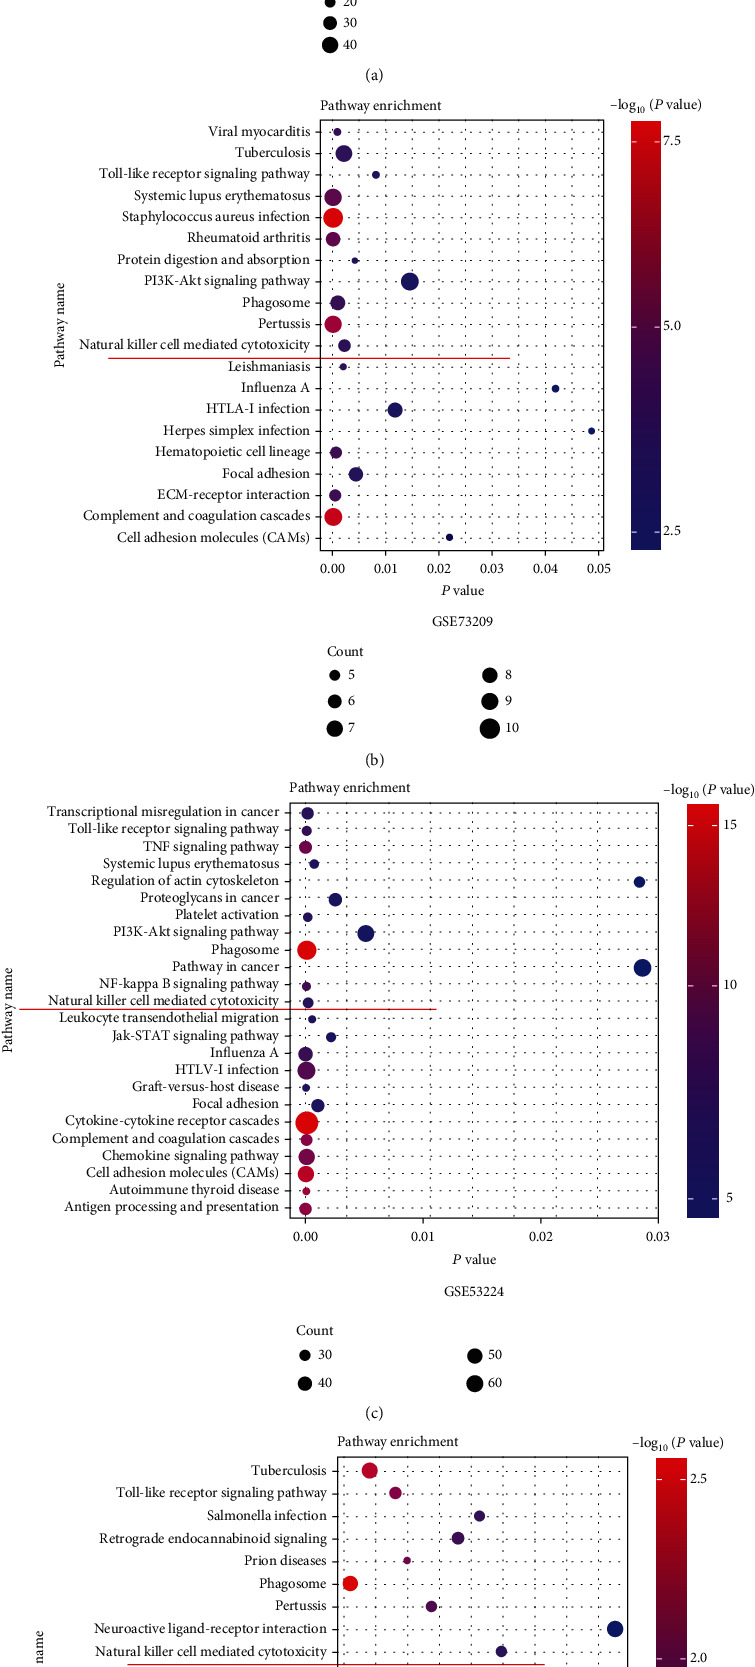
Figure 2.

DAVID enrichment analysis of the differentially expression genes between high immune scores and low immune scores in GSE66405, GSE73209, GSE53224, and TCGA-WT datasets, respectively. Red line indicated that four datasets (signaling enrichment pathway name) were natural killer cell-mediated cytotoxicity.
