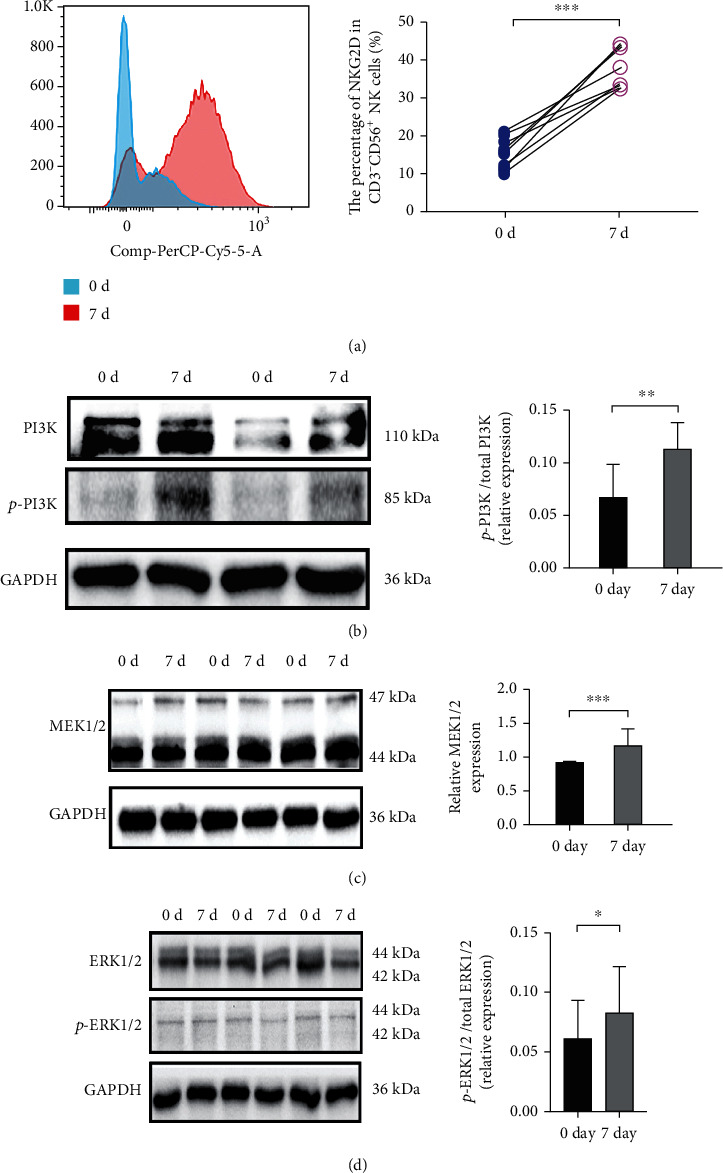
Figure 7.

The protein expression level of IL-2 and IL-15 costimulation culture 0 and 7 days. The FACS analysis NKG2D expression percentage of NK cells (a). Western blot analysis of p-PI3K/PI3K, MEK, and p-ERK/ERK protein expression levels of the uncultured NK cells compared with the IL-2 and IL-15 costimulation culture 7 days NK cells. For comparison, Student's t-test was performed. ∗∗p < 0.01, ∗∗∗p < 0.001, and ∗∗∗∗p < 0.0001.
