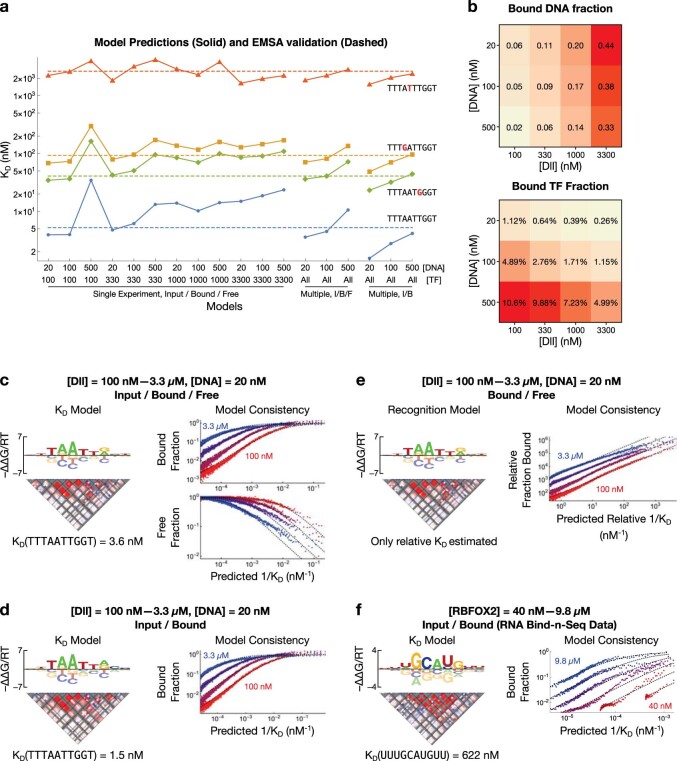
Extended Data Fig. 7. The robustness of KD-seq.
(a) Comparison between EMSA-measured (dashed line) and different model-predicted (points) KD values for four binding probes. Various model training strategies (x-axis) used different sequencing libraries: the input/bound/free libraries from a single experiment (left); the input/bound/free libraries from multiple experiments at different TF concentrations (center); or the input/bound libraries from multiple experiments at different TF concentrations (right). (b) Fraction of DNA bound (top) and fraction of TF bound (bottom) as inferred by ProBound when learning binding models from individual KD-seq experiments (cf. left points in (a)). (c) Example KD model (left) and observed and predicted probe enrichments (right; cf. Fig. 4c) for a model from the central points in (a). (d) Same as (c), but for a model from the right points in (a). (e) Same as (c), but only using the bound/free libraries (analogous to Spec-seq). This model can only predict relative KD, as the bound/free ratio is proportional to KD for all TF concentrations. In addition, the model predicts enrichment in the data up to a global rescaling factor. (f) Same as (d), but for a model derived from RNA Bind-n-Seq data for RBFOX2.

