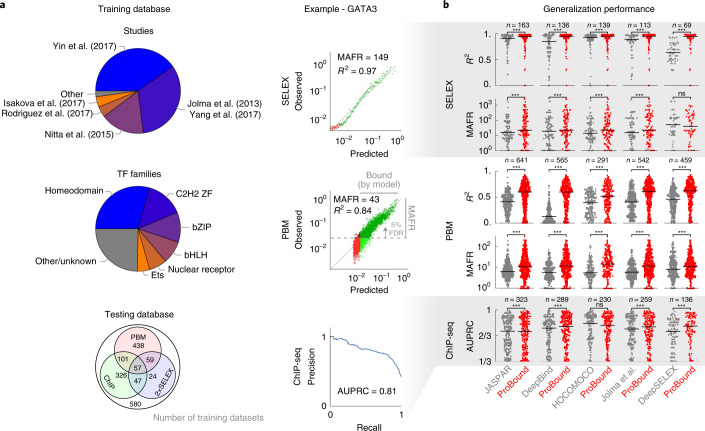
Fig. 2. Validation of TF binding model performance.
a, Breakdown of the training dataset used to build binding models by originating study and TF family (pie charts) and by availability of testing data used to evaluate them (Venn diagram). Representative SELEX (top) and PBM (middle) comparisons of observed and model-predicted binding signals used to quantify generalization performance. Each point in the scatterplots corresponds to either 500 SELEX probes or ten PBM probes; green indicates where the model predicts binding above an estimated baseline (Methods), whereas darker points indicate the MAFR of observed binding signal over which, at most, 5% of predicted binding was below the baseline. Representative precision-recall curve (bottom) for the ChIP-seq peak classification task used to quantify model performance in terms of AUPRC (1/3 corresponds to a random classifier). b, Performance comparison of ProBound models versus popular existing resources. For each ProBound and resource model pair (points), the average score was computed for all matching testing datasets. Horizontal bars indicate median performance. Significance was computed using the two-sided Wilcoxon signed-rank test (*** indicates P < 10−3).

