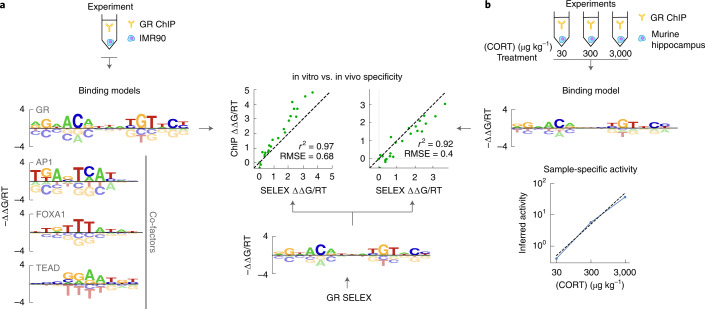
Fig. 5. ProBound learns quantitative binding models and sample-specific TF activities using peak-free ChIP-seq analysis.
a, Binding models for GR and three co-factors (left) learned from GR ChIP-seq data from the IMR90 cell line47 and for GR from a SELEX dataset (center). The scatterplot compares the energy coefficients learned from ChIP-seq (y axis) and SELEX (x axis) data7. b, Combined specificity (top) and sample-specific TF binding activity (bottom) model learned by jointly analyzing three GR ChIP-seq datasets after treatment with 30 μg kg−1, 300 μg kg−1 or 3,000 μg kg−1 of CORT51. The scatterplot (left) compares the energy coefficients as in a.

