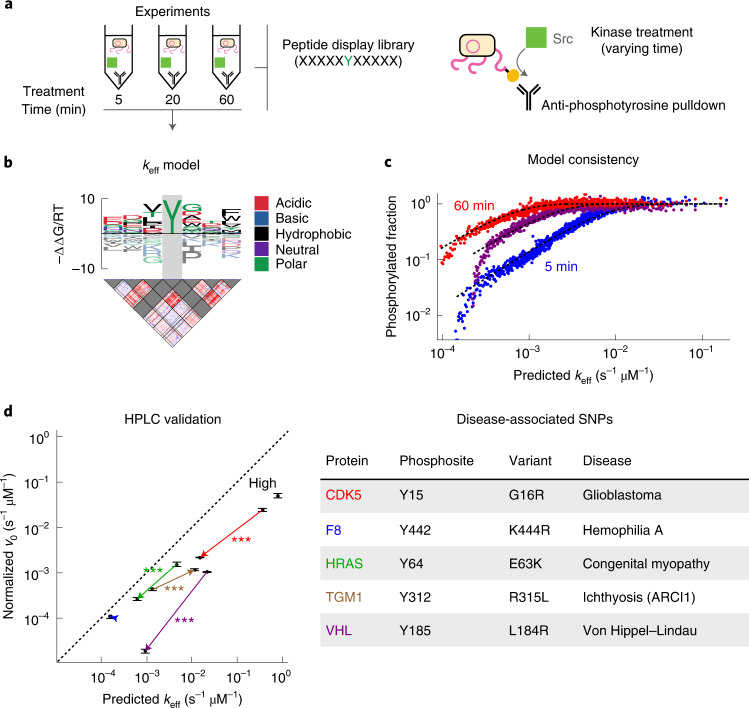
Fig. 6. ProBound quantifies sequence-dependent kinetics of the tyrosine kinase c-Src.
a, Schematic overview of the Kinase-seq assay used to profile the sequence specificity of the tyrosine kinase c-Src. b, keff model for c-Src with an energy logo (top) and an interaction matrix (bottom) trained on data from 5 minutes, 20 minutes and 60 minutes of exposure. The central position of the model was fixed to recognize tyrosine (gray). c, Comparison of the predicted keff (x axis) and phosphorylated fraction (y axis) for 5 minutes (blue), 20 minutes (purple) and 60 minutes (red) of exposure to c-Src. Points represent the average observed phosphorylated fraction for 500 probes binned by predicted keff. Dashed lines indicate expected value according to the model. d, Comparison of the HPLC-measured normalized initial phosphorylation rate v0 (y axis, n = 3 technical replicates) and the model-predicted keff (x axis) for five disease-associated WT/MUT SNP pairs (arrows) and a peptide predicted to have high activity (Supplementary Table 2). The concentration of c-Src was 500 nM and that of the substrate peptide was 100 μM. Error bars indicate the s.e.m., and P values were computed using a two-sided t-test (*** indicates P < 10−3).

