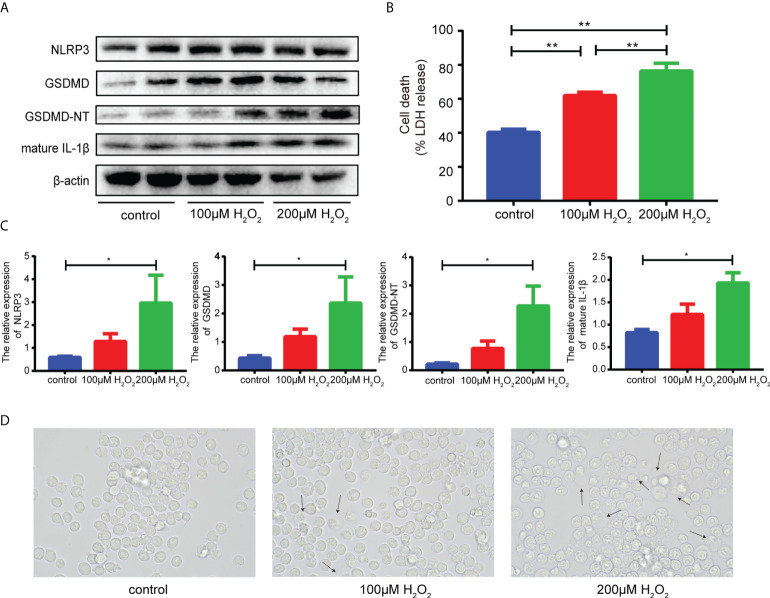
Figure 3.
(A, C), Representative Western blots (A) and averaged data (C) of NLRP3, GSDMD, GSDMD-NT and mature IL-1β in Ana-1 cells treated with H2O2. (B), The level of LDH released in the supernatant from Ana-1 cells exposed to H2O2. (D), Representative images of Ana-1 cells after H2O2 treatment. (* and ** indicated p<0.05 and p<0.01, respectively).

