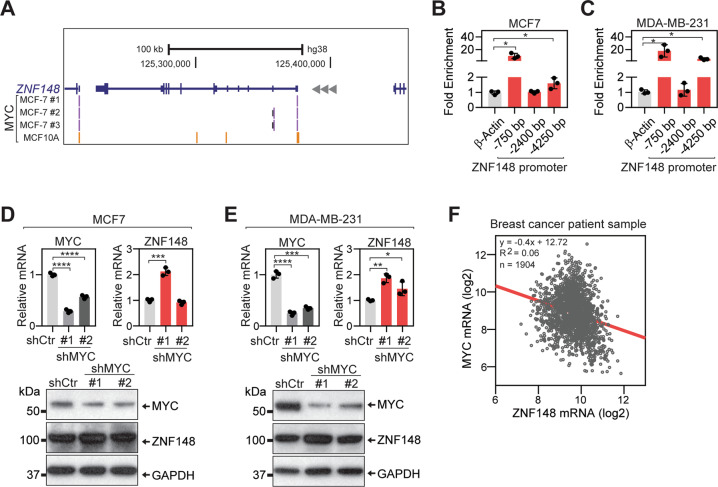
Fig. 1. MYC represses ZNF148 expression by direct chromatin occupancy.
A Schematic representation of ZNF148 locus on chromosome 3q21 reverse strand. Peak calls for MYC in MCF7 (purple bars), and MCF10A (yellow bars) cells from ENCODE [47] are indicated. B Quantitative ChIP-PCR (ChIP-qPCR) validation of MYC occupancy at −750, −2400, and −4250 bp upstream of ZNF148 promoter region in MCF7 cells (n = 3). C As in “B” for MDA-MB-231 cells. D Analysis of MYC and ZNF148 mRNA and protein in MCF7 cells transduced with the short-hairpin (sh) luciferase control (Ctr) and shMYC #1 and #2 lentiviruses, by RT-qPCR (top panel, n = 3) and Western blot (bottom panel). E As in “C” for MDA-MB-231 cells. F Scatter plot of MYC and ZNF148 mRNA levels (log2) from 1904 breast cancer patient samples in METABRIC cohort [56, 78]. Spearman correlations of −0.24 (p = 5.29−27) and Pearson correlations of −0.25 (p = 1.90−27) indicate an inverse correlation of ZNF148 and MYC mRNA levels and is depicted with a linear trend line in “red”. Student’s t-test, *P < 0.05. **P < 0.01. ***P < 0.001. ****P < 0.0001. Error bars indicate mean ± SD.

