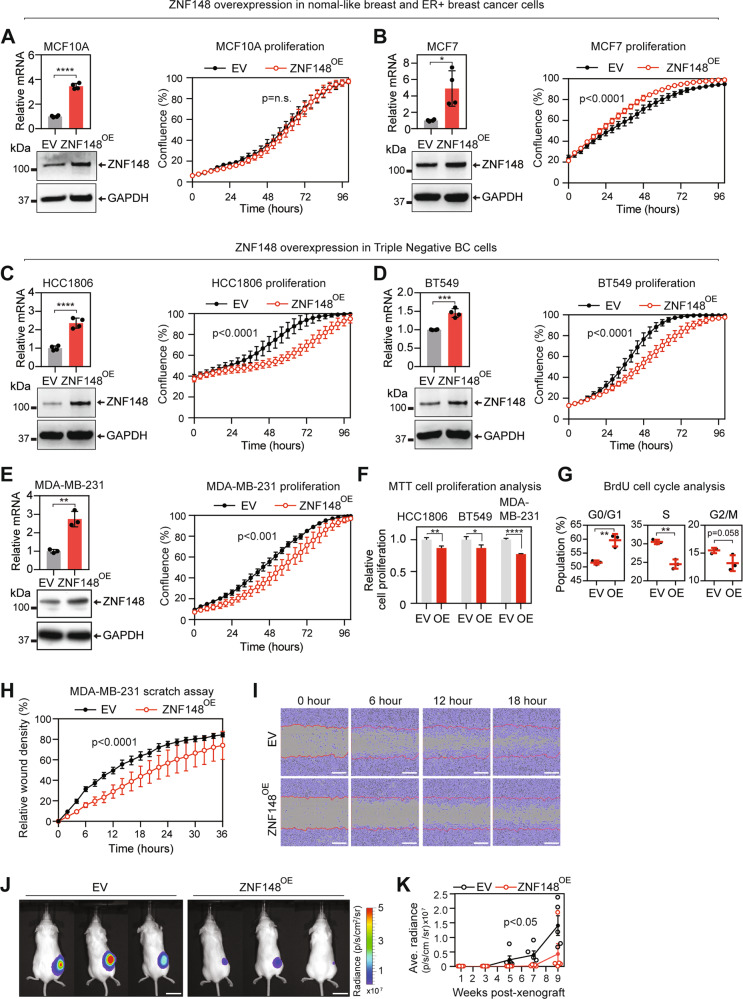
Fig. 2. ZNF148 suppresses TNBC cancer cell growth and migration.
A RT-qPCR analysis for ZNF148 mRNA transcripts, relative to GAPDH and empty vector (EV) control (n = 4, top panel), and Western blot analysis for proteins (bottom panel) in MCF10A cells transduced with ZNF148 cDNA (ZNF148OE) or empty vector (EV). Incucyte cell proliferation analysis (right panel) with percentage (%) area confluence on y-axis and time (hours) on x-axis, measured by IncuCyte® live-cell imaging over 96 h period (A representative plot from n = 3 biological replicates, each with n = 6 technical replicates, Two-way ANOVA p-values, Error bars indicate mean ± SD). B–E As in “A” for MCF7, HCC1806, BT549 and MDA-MB-231 (n = 3) cells respectively. F MTT cell proliferation analysis of cells in “C–E” 96 h post cell seeding (a representative graph from n = 3 biological replicates, each with n = 10 technical repeats, Student’s t-test, Error bars indicate mean ± SEM). G BrdU cell cycle analysis of MDA-MB-231-ZNF148OE and the EV control cells (n = 3). H Scratch wound healing assay of cells in “E” using IncuCyte®. (n = 3, Two-way ANOVA p-value). I Representative images of the cells in “E” with the cell confluent area depicted in purple and the initial scratch front at time 0 depicted as a red line. Scale bars, 300 μM. J IVIS live animal imaging of NSG mice. Representative images NSG mice at 7 weeks posted engraftment of MDA-MB-231-Luciferase cells stably transduced with empty vector control (EV) or ZNF148 cDNA (ZNF148OE) (n = 5). K Line graph with dot plot showing biweekly average radiance values of five mice from week 1 to 9. Error bars indicate mean ± SEM. (n = 5, Two-way ANOVA p-value). Student’s t-test, *P < 0.05. **P < 0.01. ***P < 0.001. ****P < 0.0001.

