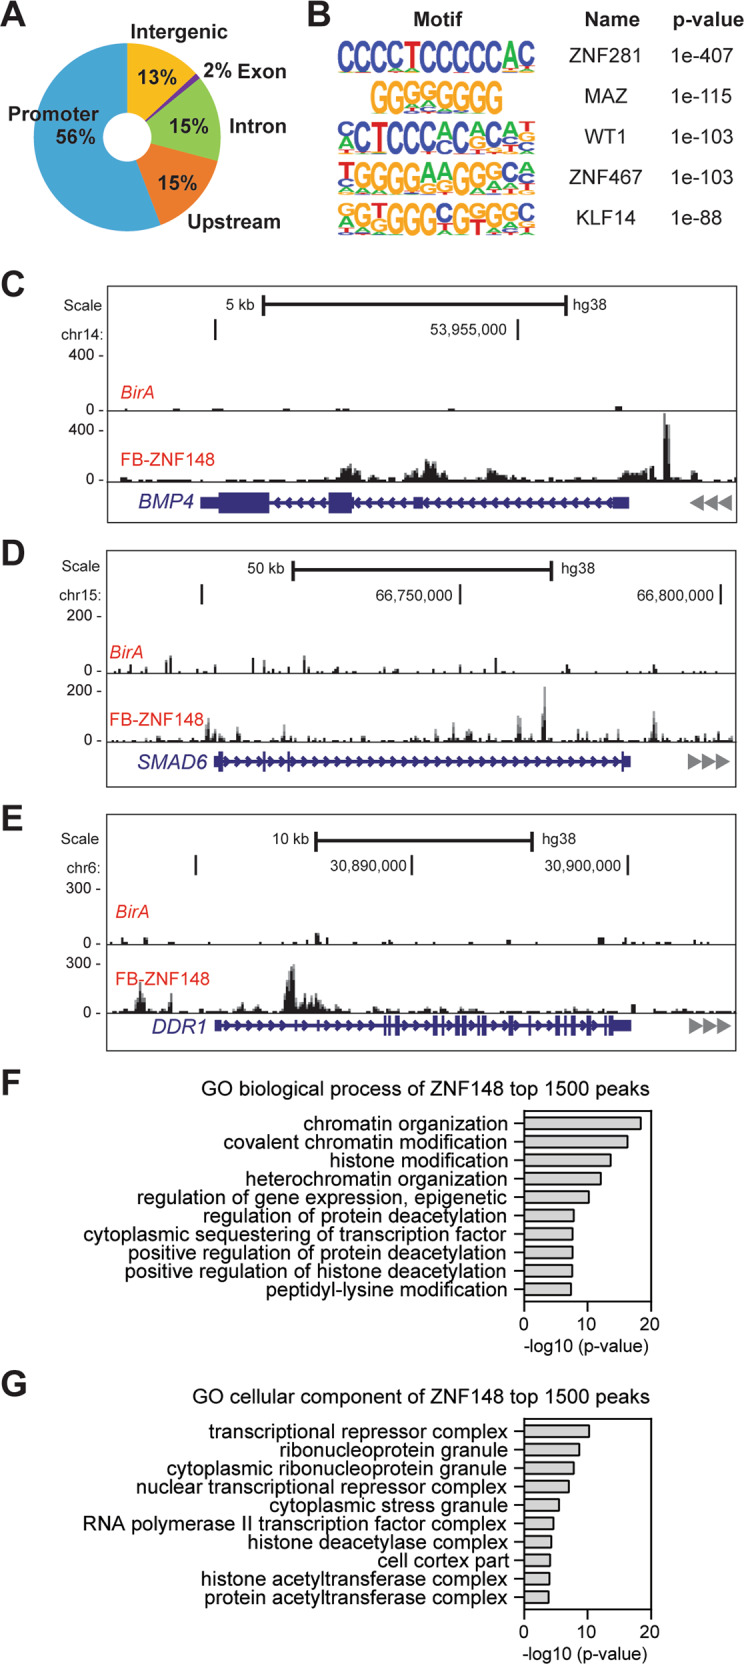
Fig. 4. Genomic targets of ZNF148.

A Doughnut chart showing the percentage distribution of ZNF148 chromatin occupancy peak locations determined by BioChIP-seq. B Consensus DNA binding motif analysis of ZNF148 occupied sequences (HOMER) [43]. The top 5 representative DNA binding sequence motifs were ranked by p-value and known transcription factors. C Representative BioChIP-seq signals at the bone morphogenetic protein 4 (BMP4) locus in MDA-MB-231 cells expressing BirA alone or BirA and FB-ZNF148. D As in “C” for SMAD family member 6 (SMAD6) locus. E As in “C” for discoidin domain receptor tyrosine kinase 1 (DDR1) locus. F GO biological process analysis of ZNF148 top 1500 peaks. G GO cellular component analysis of ZNF148 top 1500 peaks.
