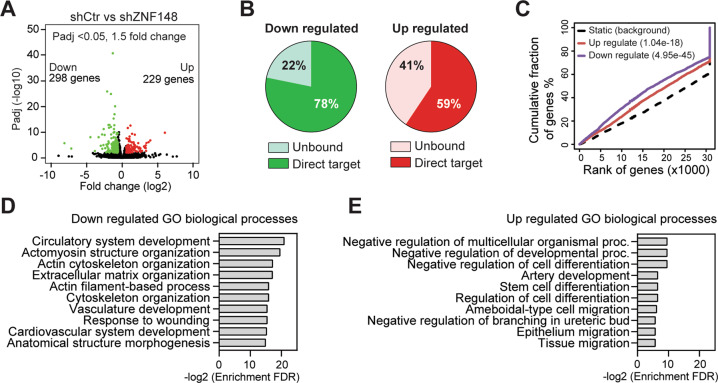
Fig. 5. Transcriptome analysis of ZNF148 knockdown cells.
A Volcano plot showing 229 upregulated (>1.5 fold) genes depicted in red and 298 downregulated (<1.5 fold) genes depicted in green (Padj < 0.05). B Pie charts showing the percentage of ZNF148-bound direct target genes or the unbound genes in up- or downregulated genes upon ZNF148 knockdown in MDA-MB-231 cells. C Transcription factor activating and repressive function prediction by BETA [44]. The upregulated (red line) and downregulated (purple line) ZNF148 target genes are cumulated by the rank on the basis of the regulatory potential score from high to low (X-axis). Both the up- or downregulated genes are significantly distributed above the non-differentially expressed static background (dashed line) by the Kolmogorov–Smirnov test [44]. D GO biological process analysis of downregulated genes from “A”. E As in “D” for the upregulated genes.

