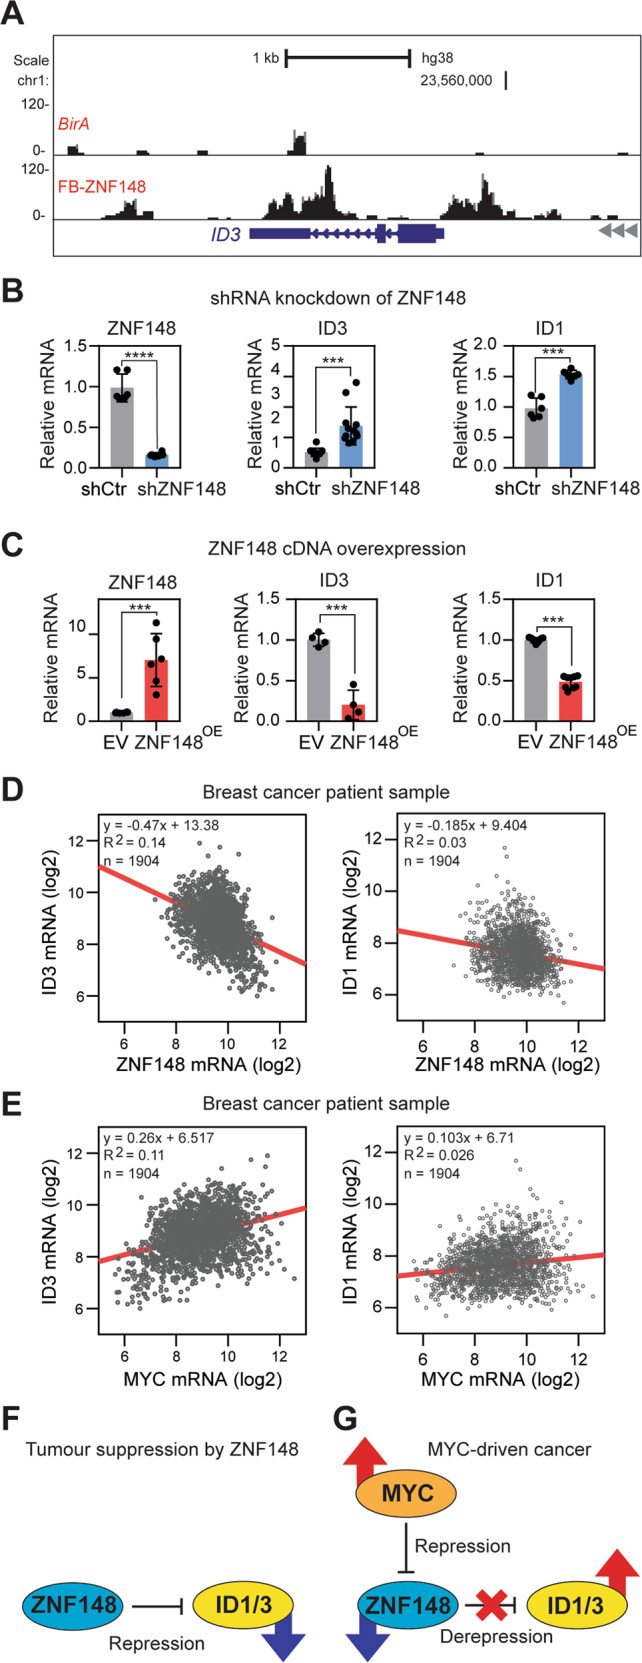
Fig. 7. ZNF148 represses ID1/3.

A BioChIP-seq signals at the inhibitor of DNA binding 3 (ID3) locus in MDA-MB-231 cells expressing BirA alone or BirA and FB-ZNF148. B RT-qPCR analysis for ZNF148 (left panel, n = 6), ID3 (middle panel, n = 12) and ID1 (right panel, n = 6) mRNA transcripts, relative to GAPDH and shControl (shCtr), in shZNF148 MDA-MB-231 cells. C RT-qPCR analysis for ZNF148 (left panel, n = 6), ID3 (middle panel, n = 4) and ID1 (right panel, n = 9) mRNA transcripts, relative to GAPDH and empty vector (EV) control, in ZNF148 overexpressing MDA-MB-231 cells. D Scatter plots of ID3 vs. ZNF148 (Pearson r = −0.3776, p < 0.0001), and ID1 vs. ZNF148 (Pearson r = −0.1761, p < 0.0001) mRNA levels (log2) from 1904 breast cancer patient samples in METABRIC cohort [56, 78]. E Scatter plot of ID3 vs MYC and ID1 vs MYC as in “D”, with Pearson r = 0.3359 (p < 0.0001) and Pearson r = 0.1590 (p < 0.0001) respectively, indicating a direct correlation of ID3/1 and MYC mRNA levels. F Schematic diagram of ZNF148 actively repressing ID1/3 gene expression. G Schematic diagram of regulatory circuitry between MYC, ZNF148, and ID1/3 in MYC-driven stem cell-like cancer. Student’s t-test, ***P < 0.001. ****P < 0.0001. Error bars indicate ± SD.
